If you're gearing up to design your next annual report, you're probably juggling data, messaging, storytelling, and the opinions of… let's say a generous number of stakeholders.
We see this constantly in nonprofit annual report projects, teams arrive with strong content and good intentions, but no clear framework for how all the pieces should work together visually. The result? Reports that feel scattered, inconsistent, or just exhausting to read.
It doesn't have to be that way.
If you're newer to the annual report process altogether, the complete nonprofit annual report guide is a good place to orient before diving into design.
Below are practical annual report design ideas to help you build a report that's clear, intentional, and donor-ready, followed by the most common pitfalls to avoid.
These aren't generic design tips. They're patterns pulled directly from the work.
→ Before you dive in: grab the free Annual Report Checkpoint
Effective Annual Report Design Ideas (What to Do)
These are the design decisions that make a report feel polished, rooted in strategy, and easy to understand.
1. Choose one clear theme
A theme gives cohesion. It helps content, visuals, and tone feel like they belong together rather than a random assortment of updates.
Strong theme examples:
- “A Year of Growth”
- “Community in Action”
- “Breaking Barriers”
Use the theme to inform photo choices, callouts, data visualizations, and headlines,not just the cover. When we work with organizations on annual report design, the theme is the first thing we lock before anything else gets touched. It's the lens everything else gets filtered through.
2. Treat each spread as one message
Instead of filling a page with five ideas, give each spread a single objective:
- A win
- A donor story
- A major program shift
- A clear impact metric
One message per spread sounds limiting. In practice it's what makes a report feel focused instead of overwhelming.
3. Use modular layouts
Modular design (consistent blocks and reusable patterns) helps you control hierarchy and reduce chaos.
Think:
- One defined style for pull quotes
- One style for stats
- One style for subheadings
- One consistent grid
It's faster to design AND easier to read. One of the most common patterns we see: organizations that don't use a modular system spend twice as long on production and end up with a report that still looks inconsistent. A defined system upfront saves everyone.
Not sure if your current report has a clear enough content structure to build a modular system around? The free Annual Report Checkpoint helps you figure that out before you touch a single layout.
4. Turn data into stories
Data builds trust. Storytelling builds emotion. You need both.
Pair metrics with short narrative lines like:
“More than 2,300 families received essential support—an increase of 38% from last year.”
That's more meaningful than a bar chart with five unlabeled rectangles. The number alone doesn't move people. The number in context does.
5. Include real voices
Testimonials, donor reflections, and client impact statements humanize the work and keep readers engaged.
Pro tip: shorter quotes hit harder. One strong sentence from a real person outperforms a paragraph every time.
A marketing leader at Peninsula Family Service came to us with a milestone 75th anniversary report that needed real community voices at the center. The alignment work upfront meant every voice in the report earned its place.
"It took very few revisions to reach the final product."
6. Use a strong visual hierarchy
Hierarchy helps your reader scan and digest quickly. Try:
- Large headlines
- Medium subheadings
- Smaller body copy (10-11pt at minimum is best!)
- Contrasting weights instead of multiple fonts (i.e., many fonts have bold, semibold, and regular weights—use those intentionally to create hierarchy.)
7. Be intentional with color
A restrained color palette (one primary color, two to three accents) makes a report feel polished and credible. Use bright or secondary brand colors to highlight key takeaways, not everywhere.
In our experience working with nonprofit communications teams, color is one of the fastest ways a report signals either "we know what we're doing" or "we're figuring it out as we go." Restraint reads as confidence.
8. Use high-quality photography
Skip the collage look. Select fewer, but stronger, images that feel authentic and reflect the actual work.
When photo quality varies across your collection: black-and-white is an elegant equalizer. It creates cohesion without you having to reshoot anything.
9. Create a logical reader journey
Think beginning → middle → end.
A suggested flow that works well:
- Mission + message
- Highlights
- Impact + data
- Community stories
- Financials
- Future vision + invitation to engage
It should feel guided, not scattered. Donors shouldn't have to work to understand what you're saying.
A marketing team member at East Bay Community Foundation described working through this process together:
"One highlight of working with Acton Circle is their excellent facilitation of strategy meetings. They thoroughly capture all the information needed and make translating project needs into a design look like magic."
.avif)
Get The Annual Report Checkpoint
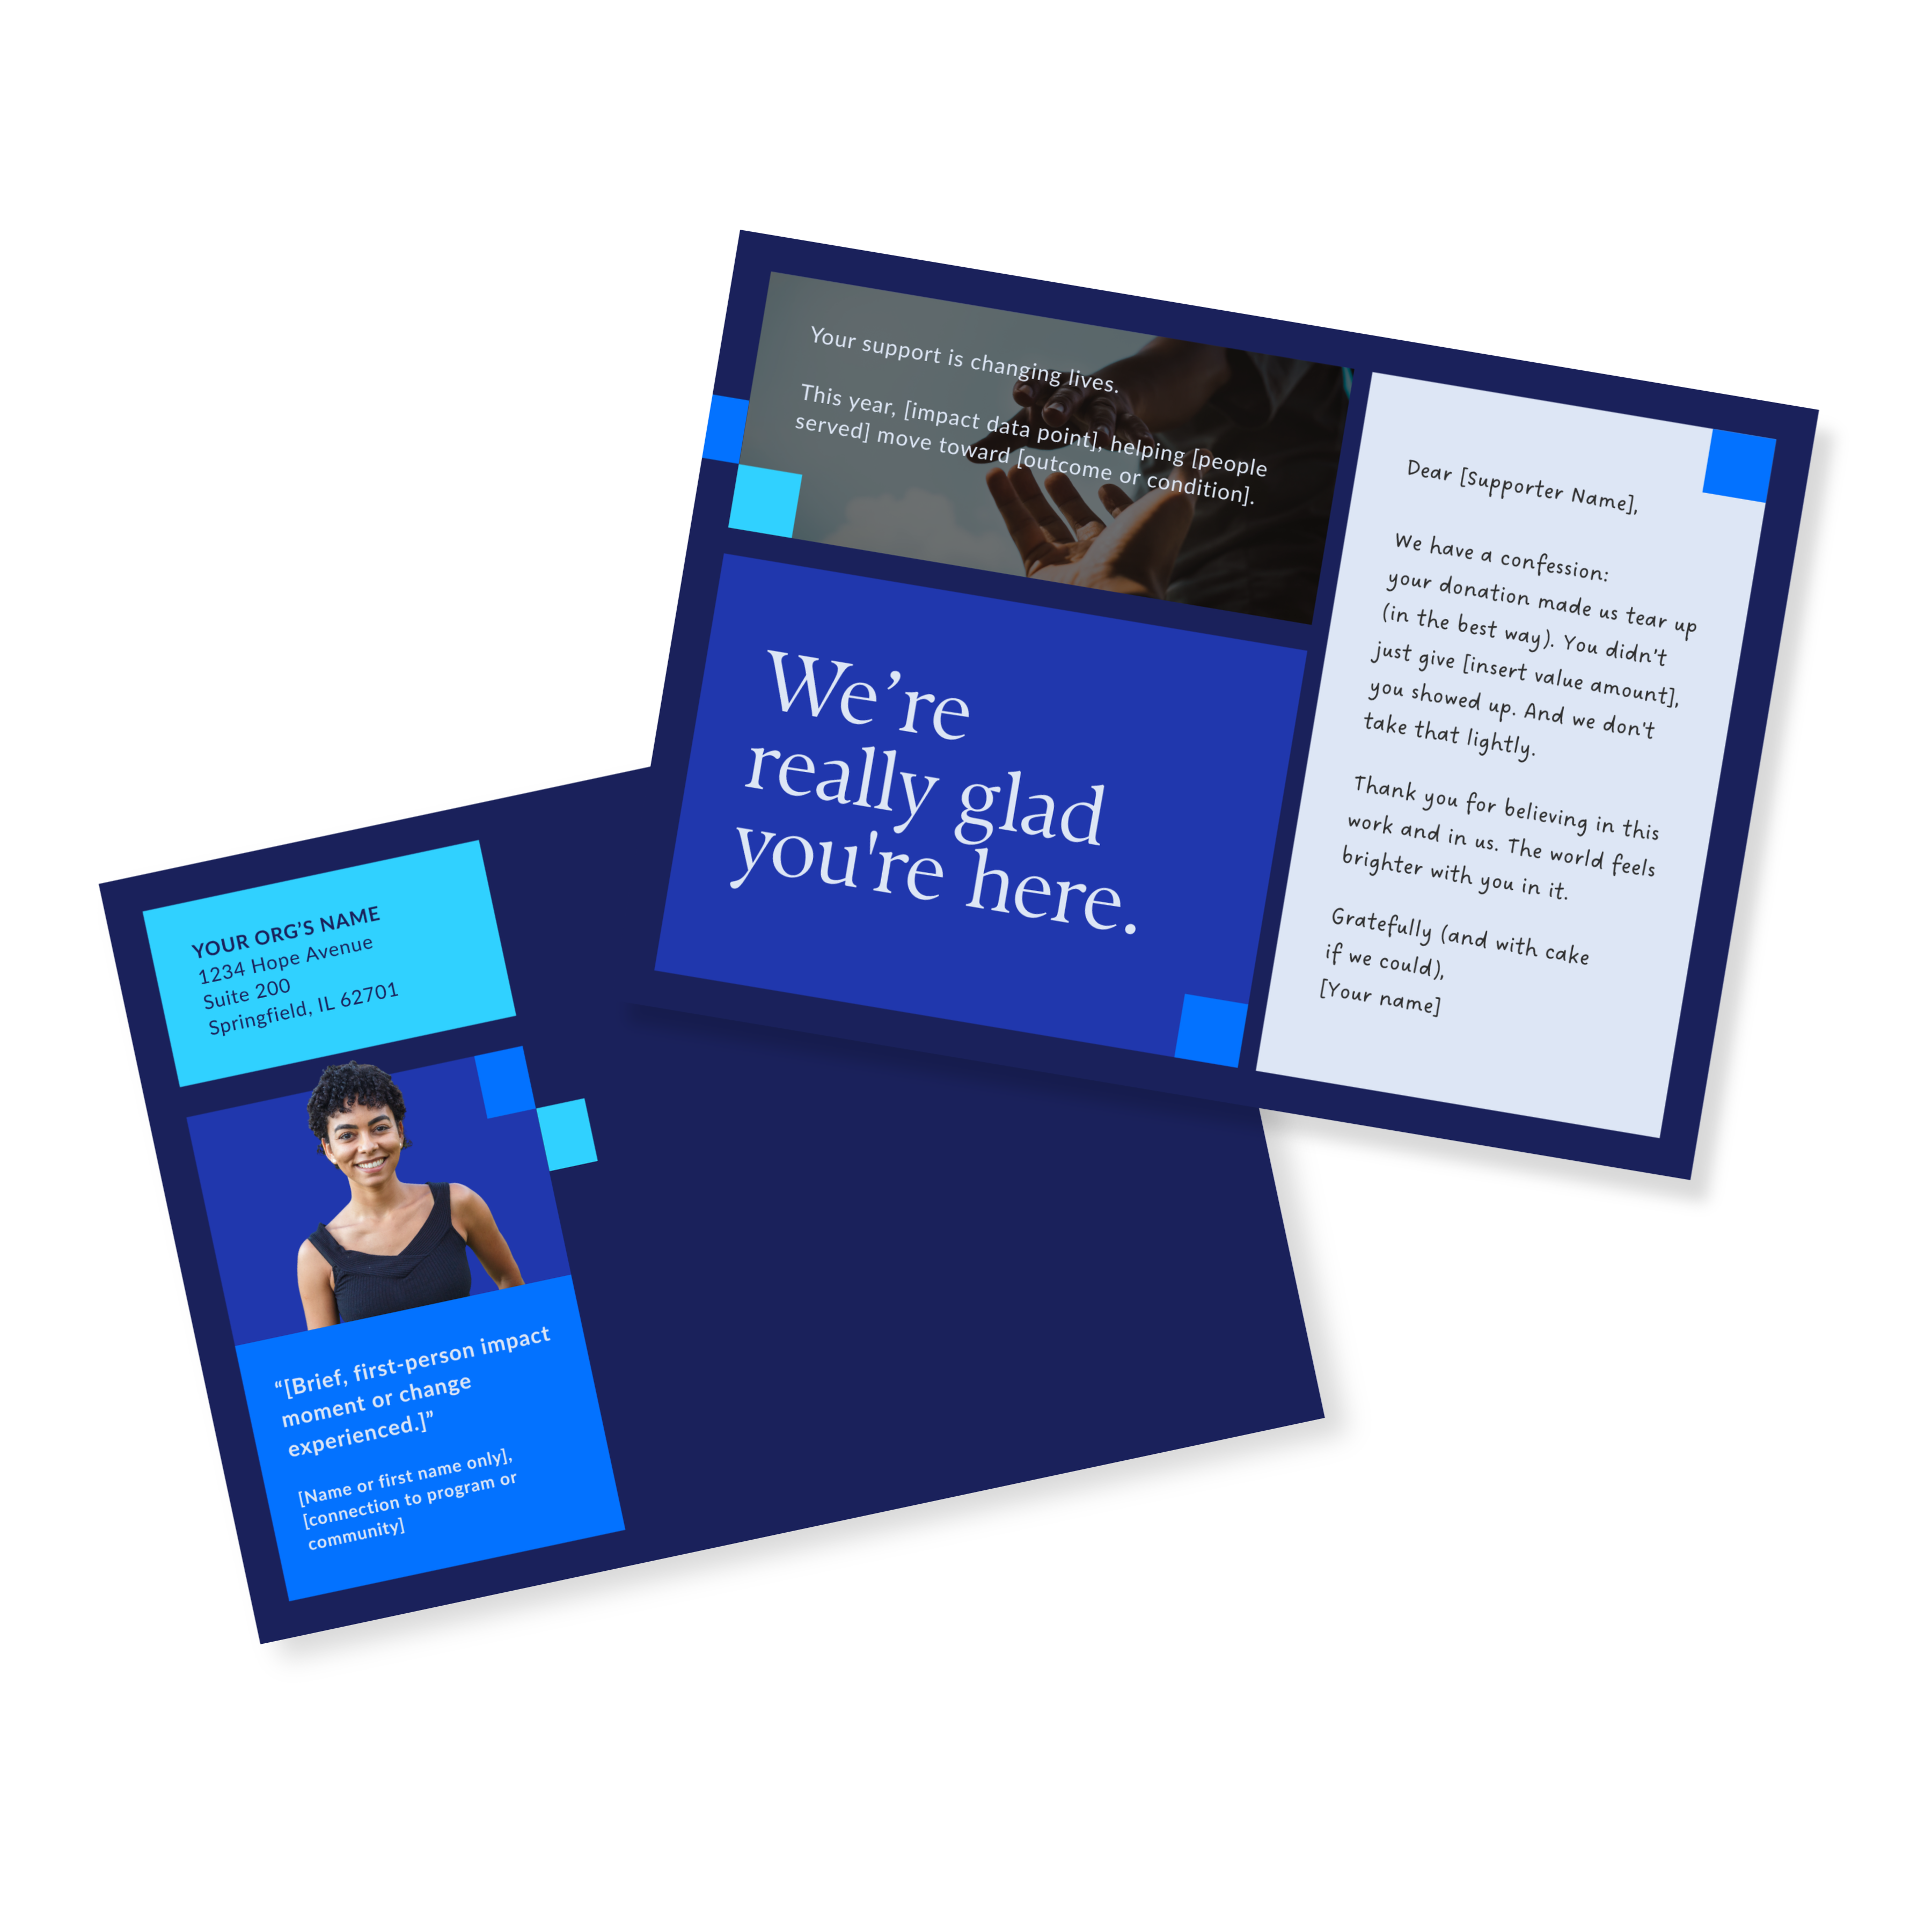
Donor Thank You Postcards Templates
Enter your info and we’ll send the postcards straight to your inbox:
10. Make it accessible across formats
Modern annual reports aren't just PDFs. They get used for:
- Web pages
- Social graphics
- Slides
- Grant packets
- Fundraising meetings
This is what we call designing for the Repurpose Revolution, building your report as a content system, not a one-and-done document. When you think in components from the start, the design scales without starting from scratch every time.
If you're building this in-house, our Annual Report Template Kits are designed with exactly this modularity in mind. Every layout is built to work as a standalone piece AND as part of a larger system.
Common Annual Report Design Mistakes (and How to Fix Them)
These are the patterns that show up year after year. Naming them is half the battle.
Mistake 1: Trying to say everything
When every detail feels essential, nothing stands out. This is one of the most consistent challenges we address during Annual Report Design Intensives, the instinct to include everything because everything feels important to someone on the team.
Fix: Prioritize. Keep the core narrative in the report and repurpose the rest for email, web, or social. The report is not the only place a story can live.
Mistake 2: Inconsistent layouts
Margins shift, spacing changes, nothing feels unified. It doesn't have to be dramatic inconsistency to erode trust. Small visual irregularities add up fast.
Fix: Use a grid system and a style sheet. Repeat visual rules so the report feels intentional from cover to back page.
Mistake 3: Too many fonts or sizes
Visual noise is one of the fastest ways to undermine professionalism and it's almost always unintentional.
Fix: Stick to one to two typefaces used consistently for headings, subheads, and body text. Use weight variation within a single font family before reaching for a new one.
Mistake 4: Charts without context
Great data poorly presented is still confusing. A beautifully designed chart that requires your donor to figure it out themselves has already failed.
Fix: Label clearly, simplify shapes, and add a line of context that explains what the number means for real people.
The CEO at Chiron Community Giving Foundation came to us with complex mental health research that needed to feel accessible and credible to community partners and policymakers. Getting the data presentation right was the whole game.
"A beautiful job bringing our foundation's report to life. The visualized data and narrative were enhanced by the very professional graphic design services provided by Acton Circle."
Mistake 5: Ignoring accessibility
Low contrast, text over busy images, and unlabeled visuals aren't minor details. They're barriers.
Fix: Make sure there's strong contrast. Avoid text on busy photos. Add alt text and logical reading order for digital PDFs.
Mistake 6: No story arc
A report that reads like a spreadsheet misses the entire point. Data without a story is just information. Donors need to feel the work, not just understand it.
Fix: Build story flow: why the work is important, who it served, and what happens next. That arc is what makes a donor want to stay invested.
Mistake 7: Reinventing the wheel every year
Starting from scratch every year wastes time AND creates inconsistency in how your organization shows up to donors over time.
Fix: Build a repeatable design system. Each year's report should improve on the last, not restart from zero. This is exactly what the Annual Report Planner helps you build, a clear content roadmap that carries forward year over year.
The VP leading marketing and storytelling at Making Waves Education Foundation worked with us across four consecutive annual reports. Each one built on the last—same design language, sharper story every year.
"Olivia takes the time to really understand our nonprofit organization's mission as well as the goal, audience, and style for each project."
Start With The Foundation
Great nonprofit annual report design can't make up for a report that isn't built on the right story.
Before you open a design file or start pulling content, run your report through the Annual Report Checkpoint. It gives you a clear picture of where your report stands across story, credibility, design, and donor journey—so you know exactly what to prioritize before the work begins.
Click here to get the Checkpoint
And if you're ready to hand the design work to a team that builds reports that do fundraising work, the Annual Report Design Intensive is where that happens.