After years sitting alongside nonprofit comms teams as their design partner, I've watched annual report season unfold from a front-row seat at enough orgs to know exactly where it goes left.
When I worked on retainer, I got as close as possible to being inside the org. I was still a partner, not a staff member. That perspective taught me more than I expected. Being one step removed helps you notice the patterns.
And the patterns are everywhere.
These are the seven lessons from tight deadlines, redesigns, and first-time projects that changed how I think about annual report design. Actual hard-won lessons from real projects.
Lesson 1: The Outline Is the Report. Everything Else Is Execution.
When I first started, I saw teams hold off on design until all the content was finished. It seemed logical at the time, right?
But in the nonprofit world, content is never really final. There's always another round of edits from leadership, another stat to double-check, or another board member with feedback. (And bless them, truly. But also… the deadline doesn't move.)
After seeing this happen on many projects, I learned that starting earlier gives leadership time for feedback without slowing down the design process. Even if the content isn't perfect yet.
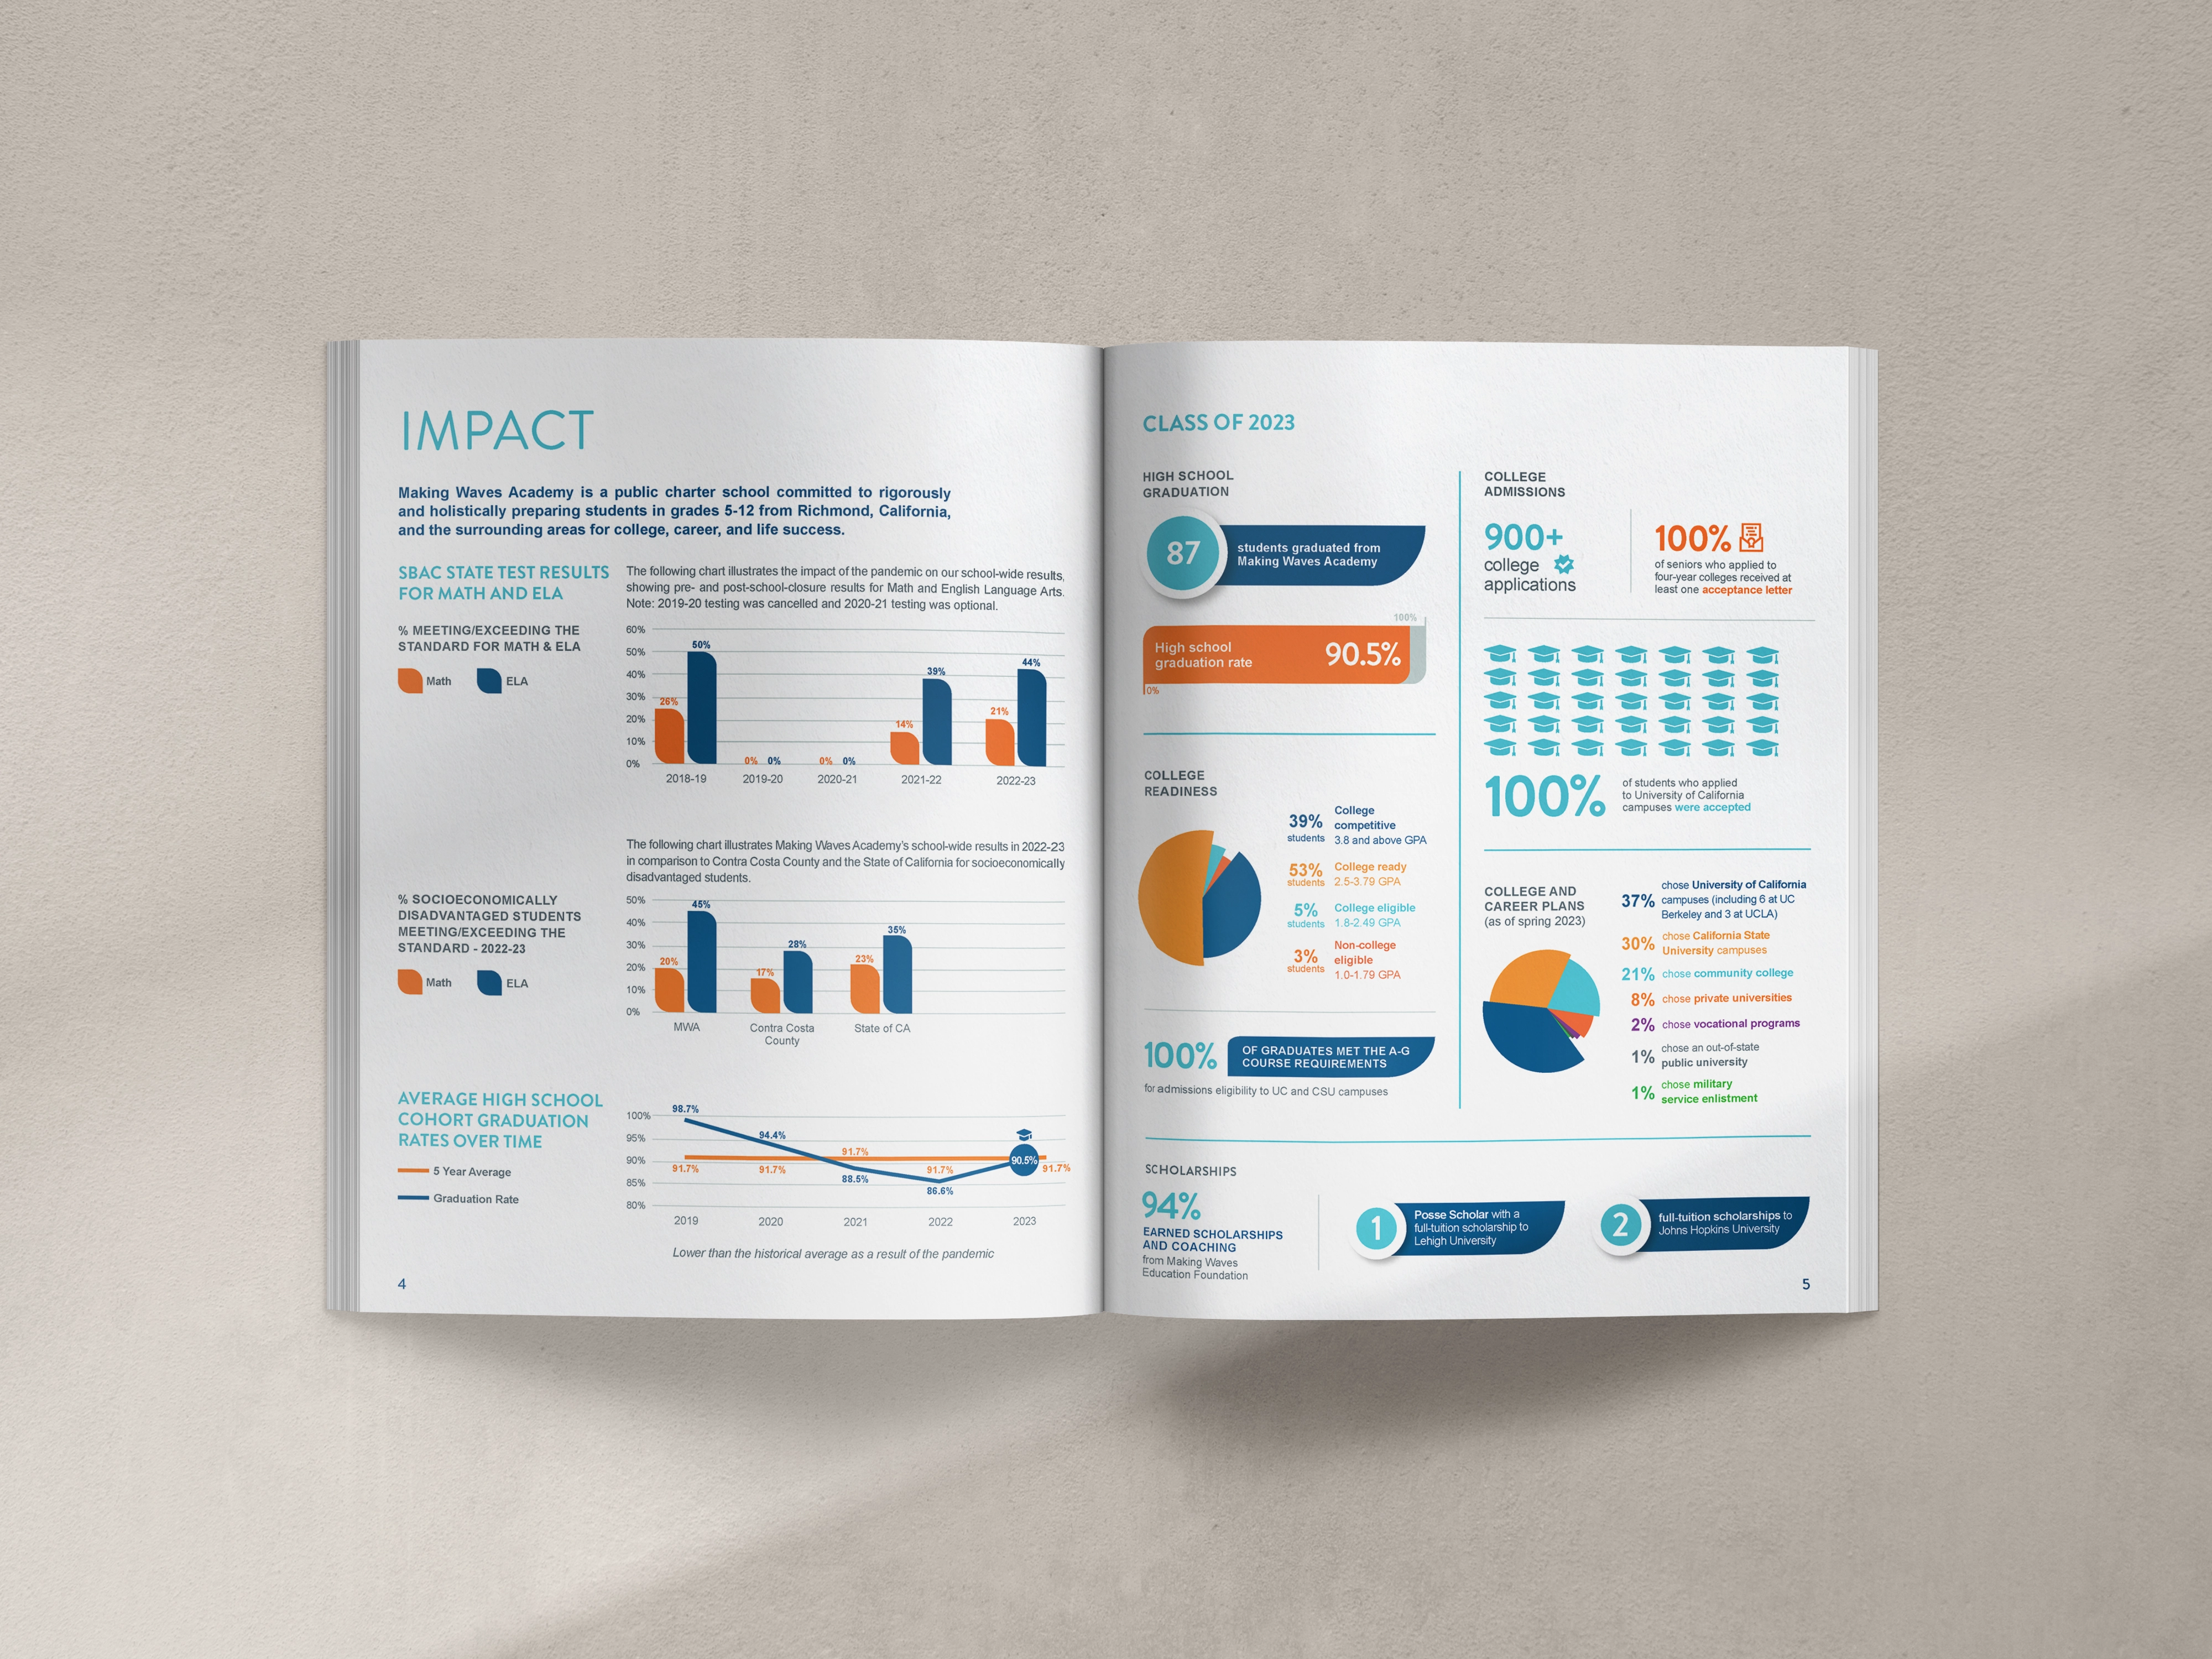
The annual report projects that ran late all had one thing in common: the main decision-maker didn't review the outline or drafts early on. The smoothest projects had the outline approved before any design work began. Every. Single. Time.
The real lesson: your designer should be in the room when you're building the outline. Not to design, but to help think through how the story will flow visually. That's when the best storytelling choices happen. And it only takes a conversation.
Lesson 2: A Theme Isn't a Nice-to-Have. It's What Makes the Report Memorable.
Annual reports without a theme end up as a very polished pile of facts. (I say this with love. I've designed that pile. I know what it costs.)
When a report has a theme, it tells a story. Donors remember stories. They do not remember bullet points.
In Tides' annual impact reports (our top fav projects), the themes reflected the org's commitment to empowering BIPOC leaders. A stronger activist voice came through in the leadership letter, the data, the visuals, the language. Everything worked together to support one message.
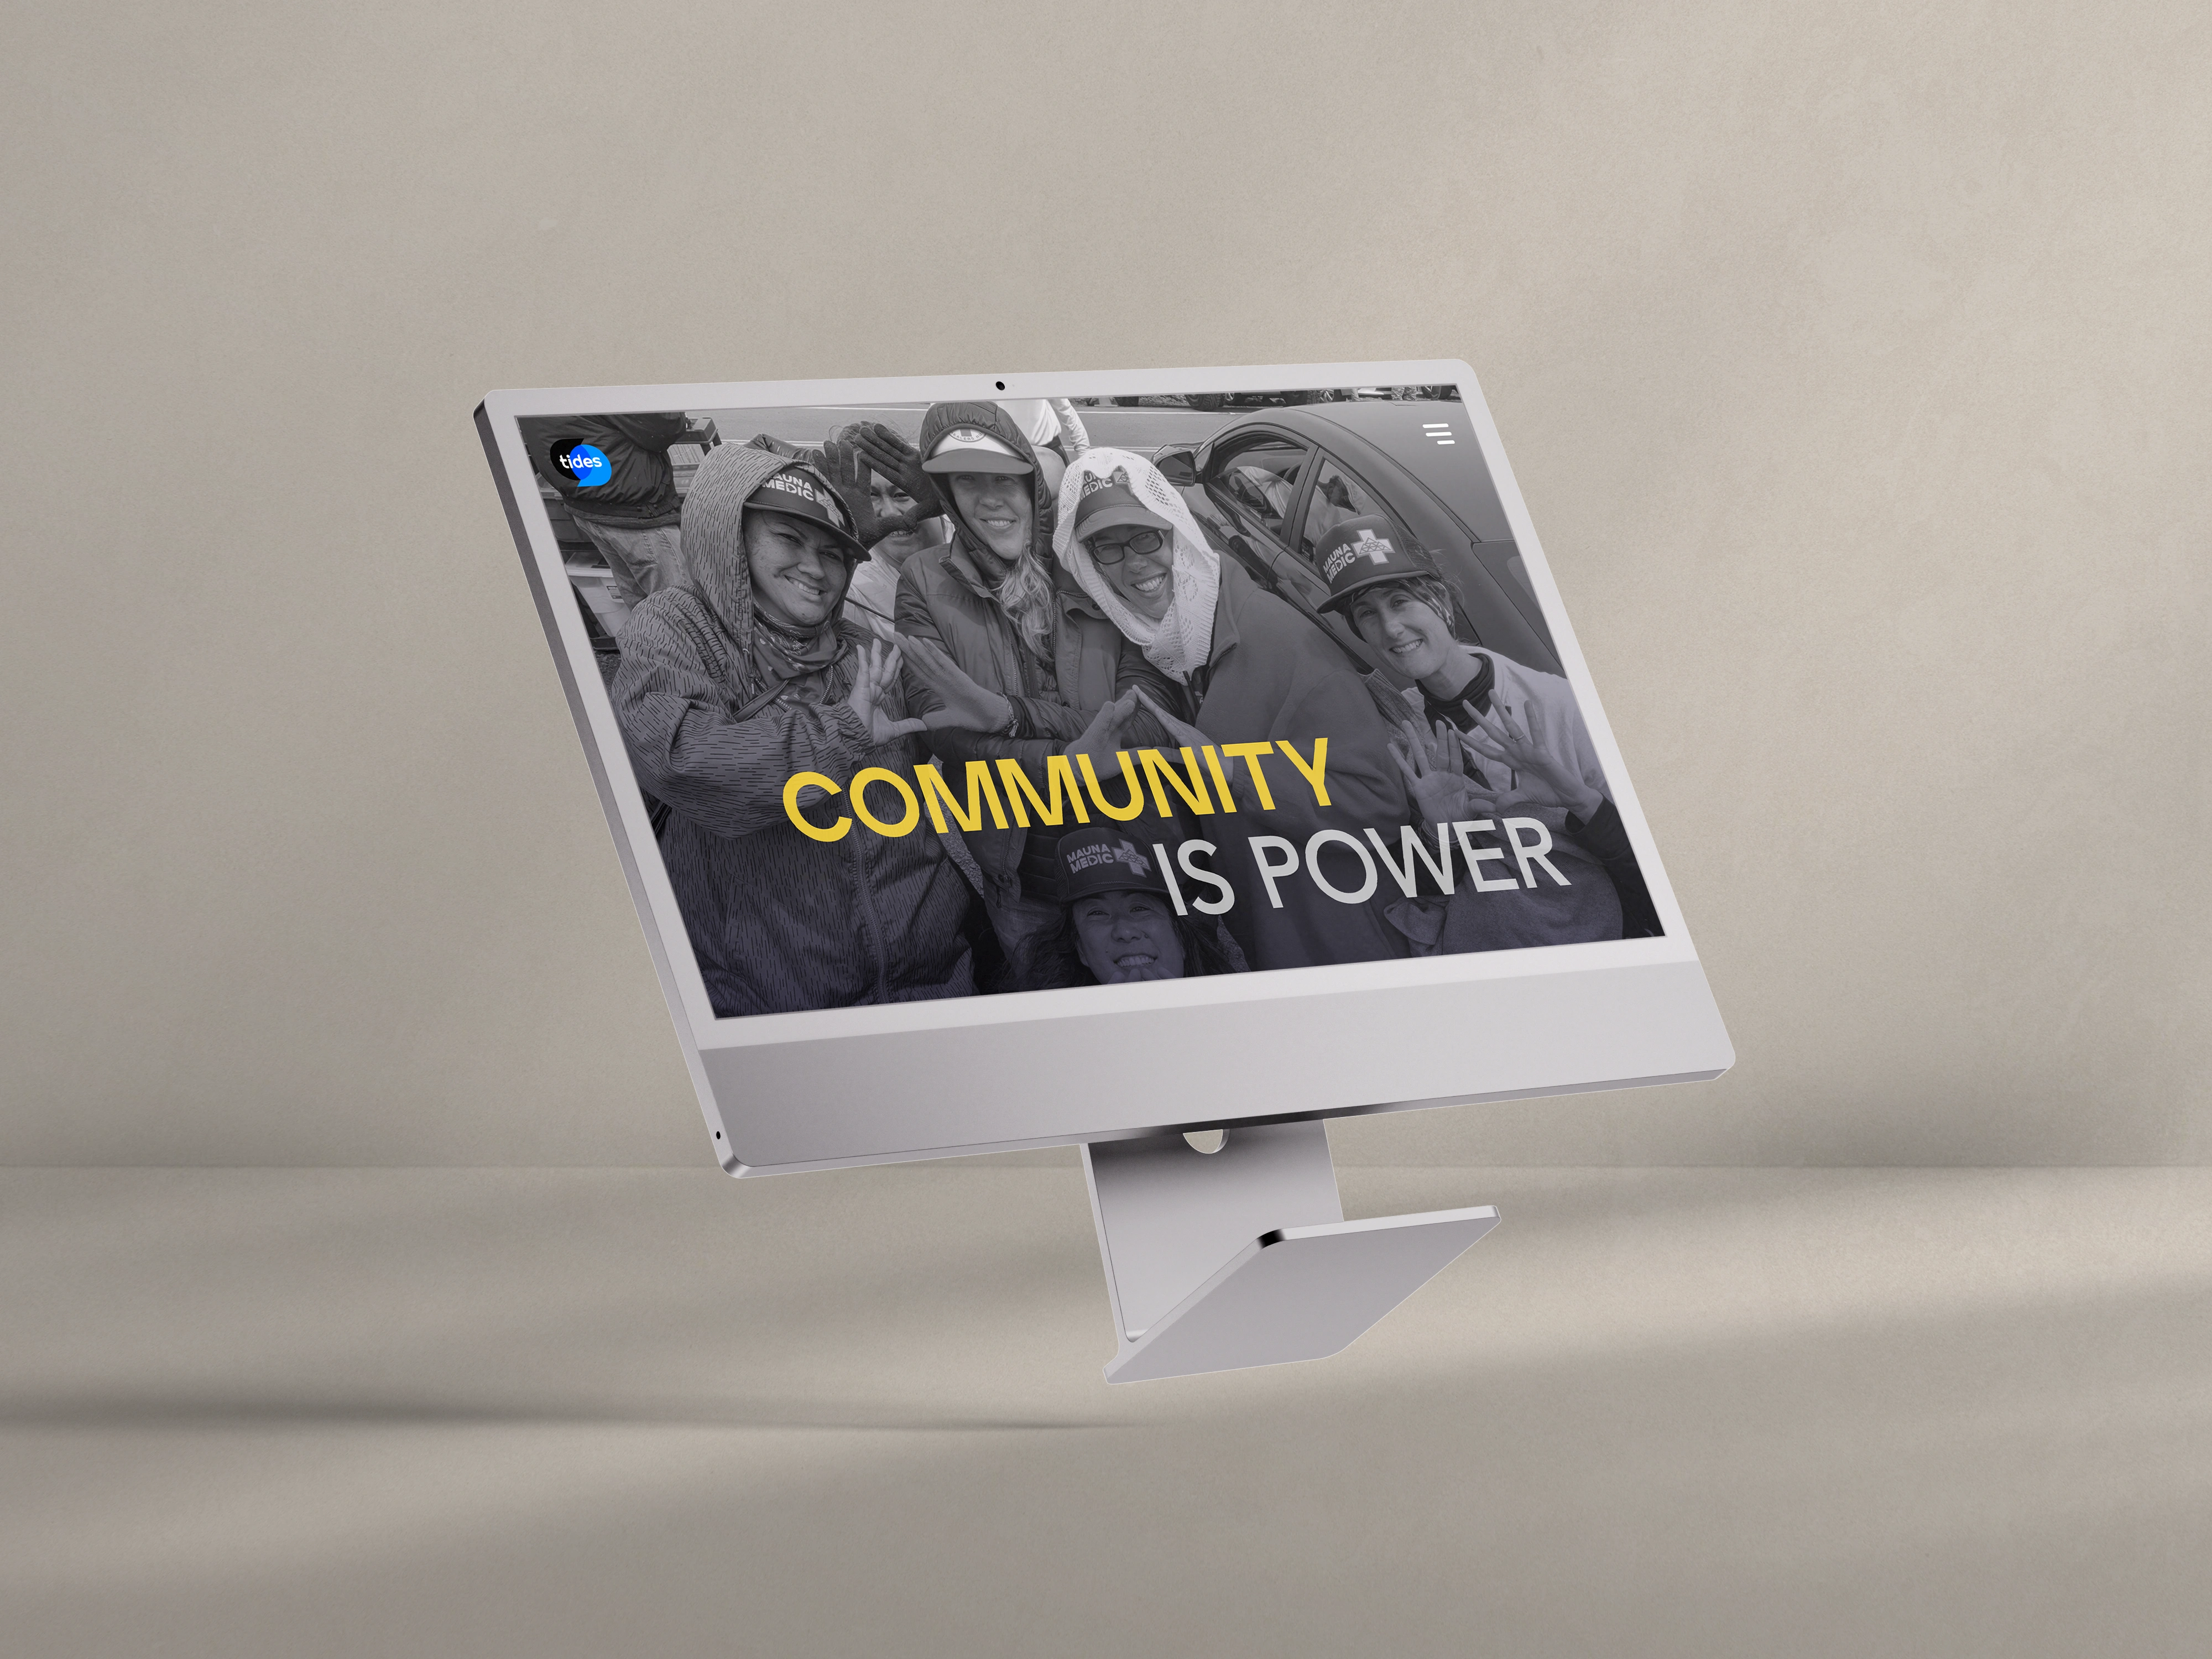
That's what a strong theme does. It gives every design choice a clear reason. Instead of asking, "should we use a photo here?" you ask, "does this photo serve the story we're telling?"
Don't start working on a report until you've chosen a theme, or at least have a few real options on the table. Without a theme, you're just making things look good. Looks alone don't inspire belief.
Lesson 3: If You're Not Designing for Repurposing, You're Leaving a Year of Content on the Table.
I wish someone had told me this earlier. I've seen orgs spend months gathering stories and data for their annual report, only to never use it again after the PDF goes out.
That content? It can fuel an entire year of:
- Grant application narratives
- Donor presentation slides
- Social media content
- Website copy and impact pages
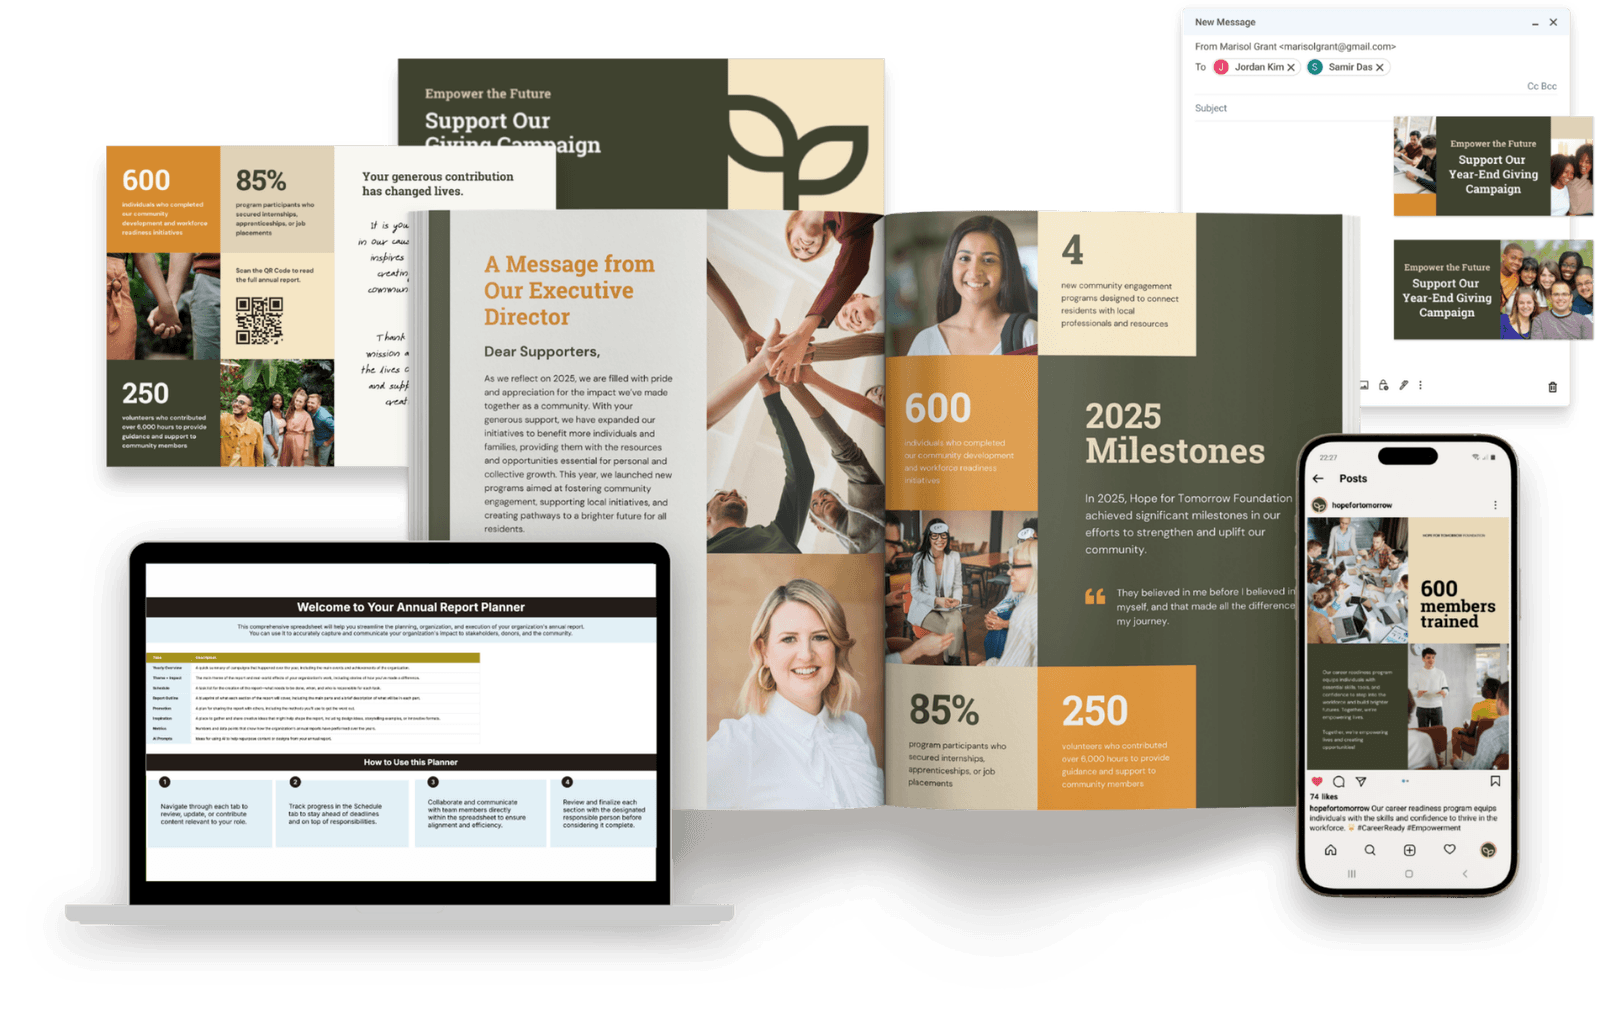
The orgs that plan to reuse their content from the start get much more value from the same report. Same effort, but much more reach. Once you notice this, it becomes obvious, and you can't ignore it.
Lesson 4: A Donor List Is Fine. A Donor Story Is Better.
I've come across beautiful annual reports that devote entire pages to long lists of names in tiny print. Sure, donors are listed. But do they actually feel seen?
The reports people keep, share, and bring up at board meetings are the ones with real stories. Why does a donor give? What have they witnessed because of this mission? What does this work mean to someone who didn't have to care, but chose to care anyway?
If your donor recognition section reads like a tax form, it's not building relationships. It's just documentation.
(And yes, some donors want to stay anonymous. Respecting that is just as important as celebrating those who are named. Honoring the quiet ones is part of the stewardship, too.)
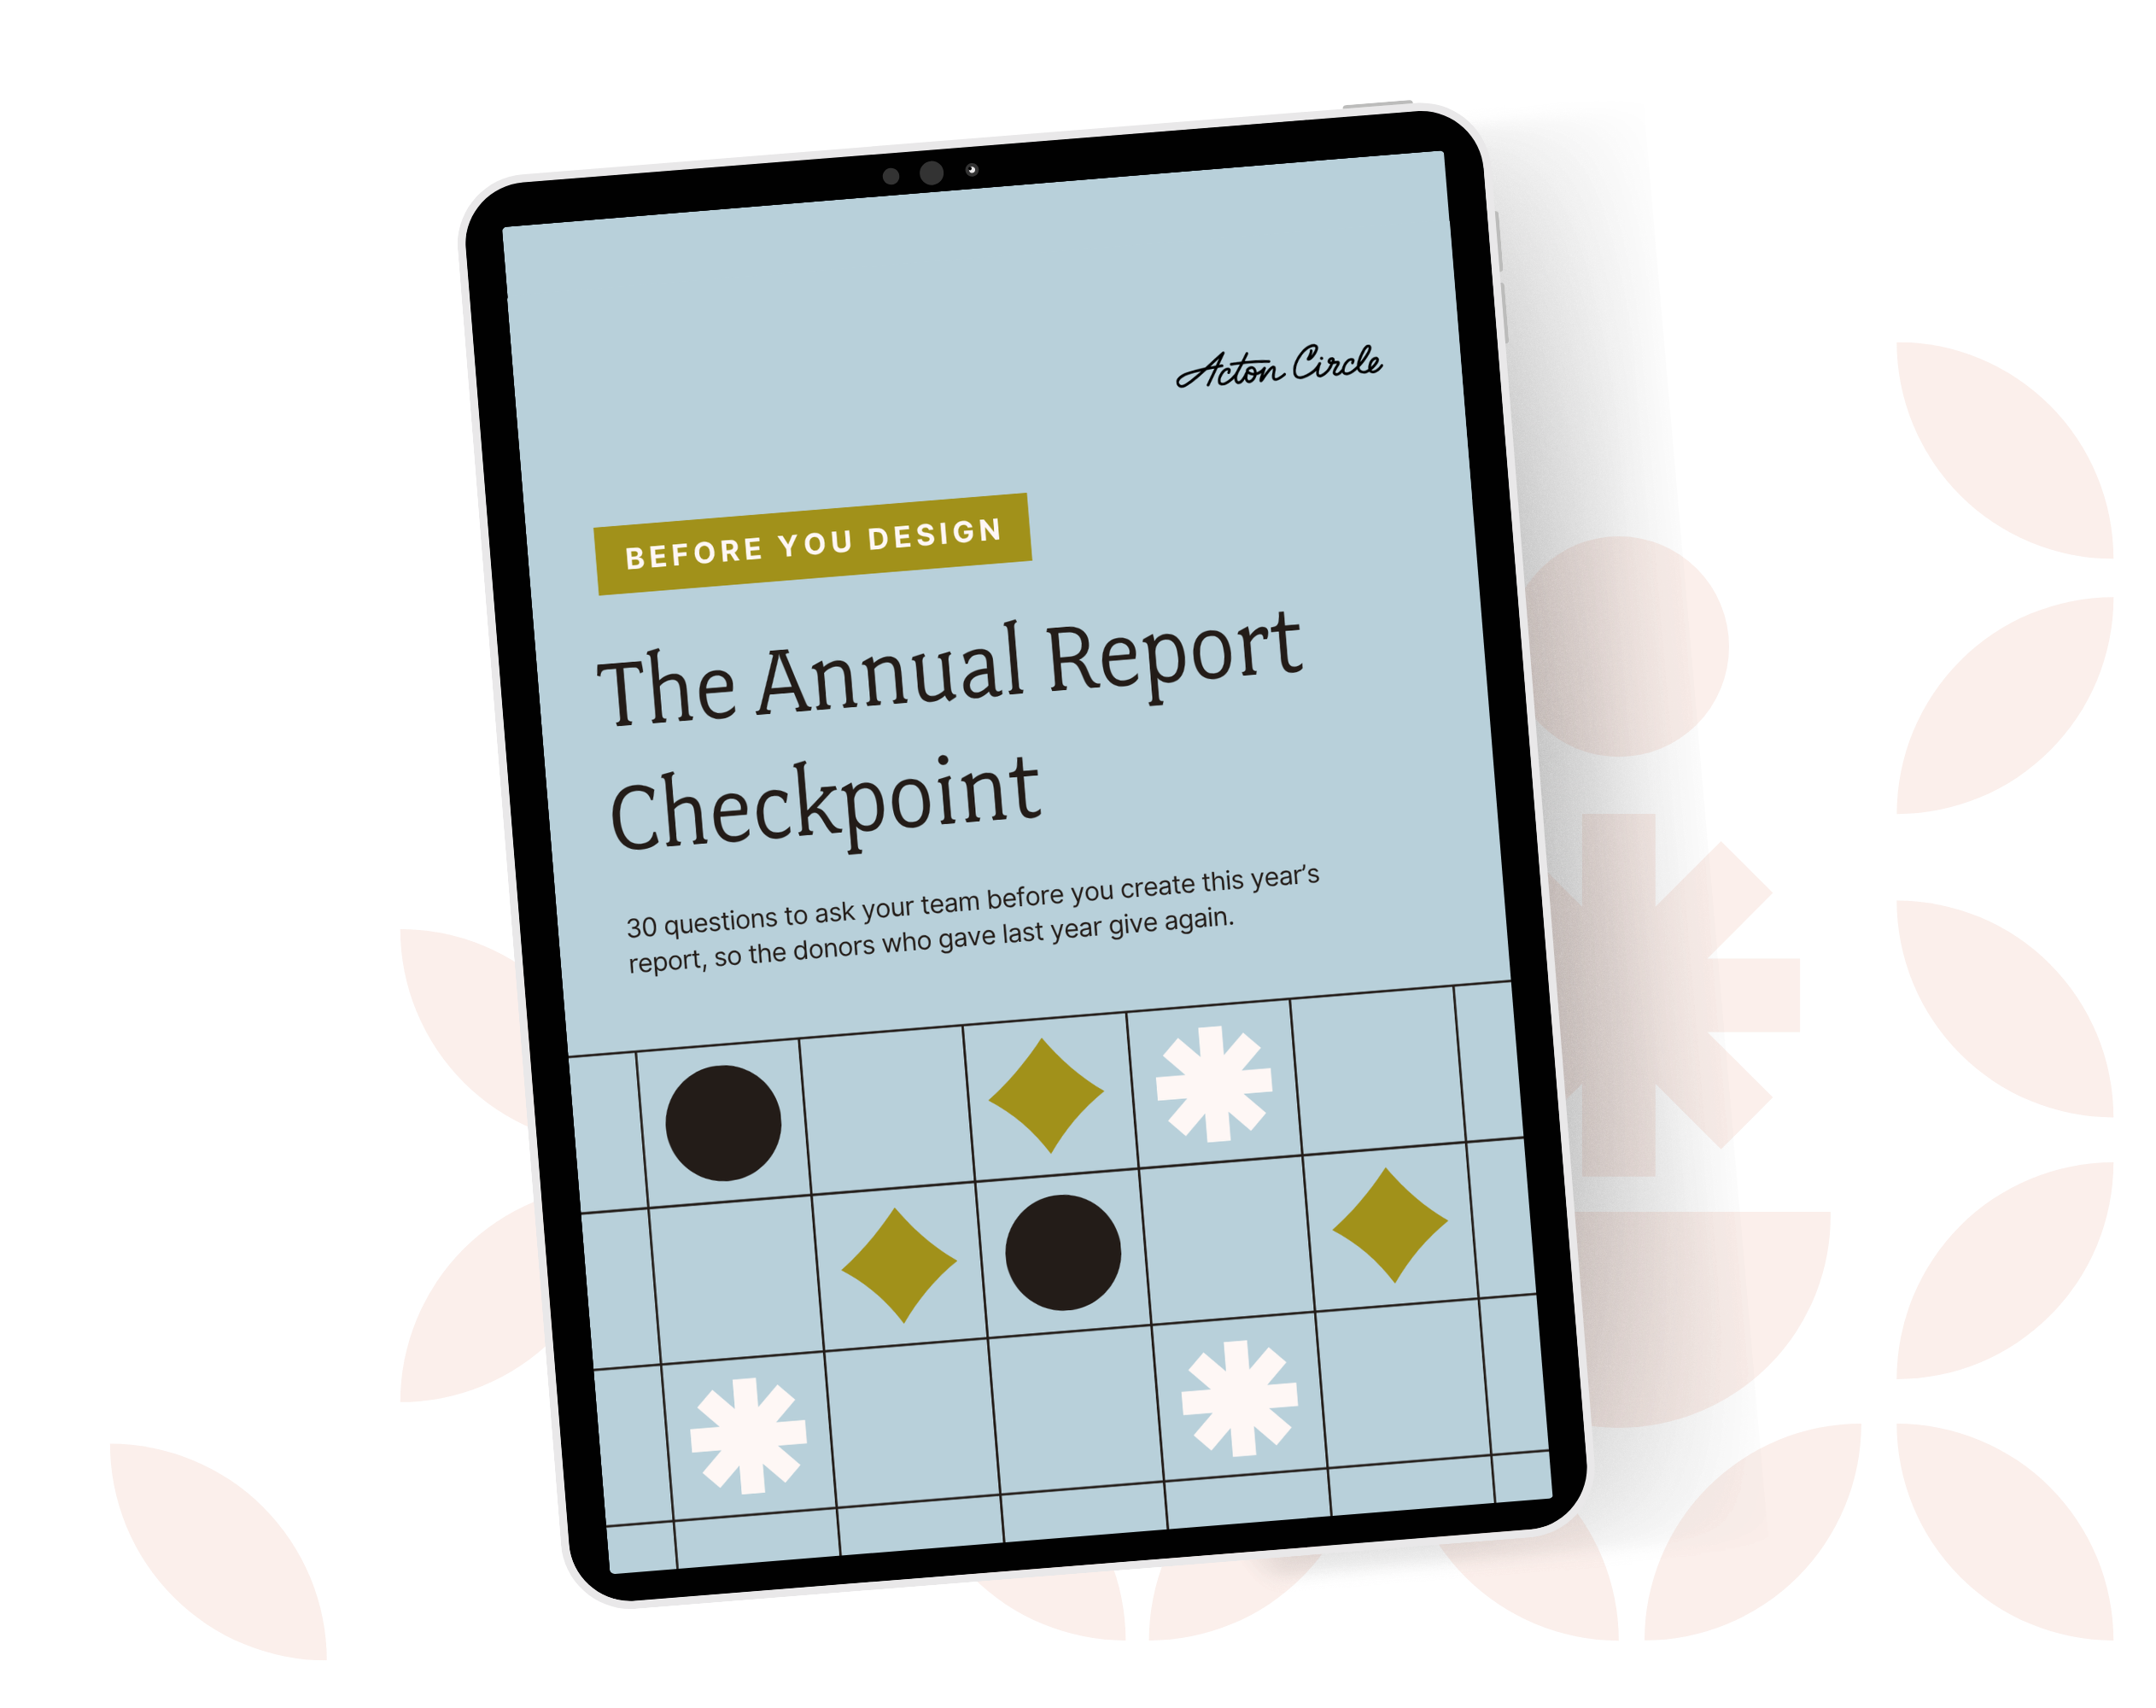
Get The Annual Report Checkpoint
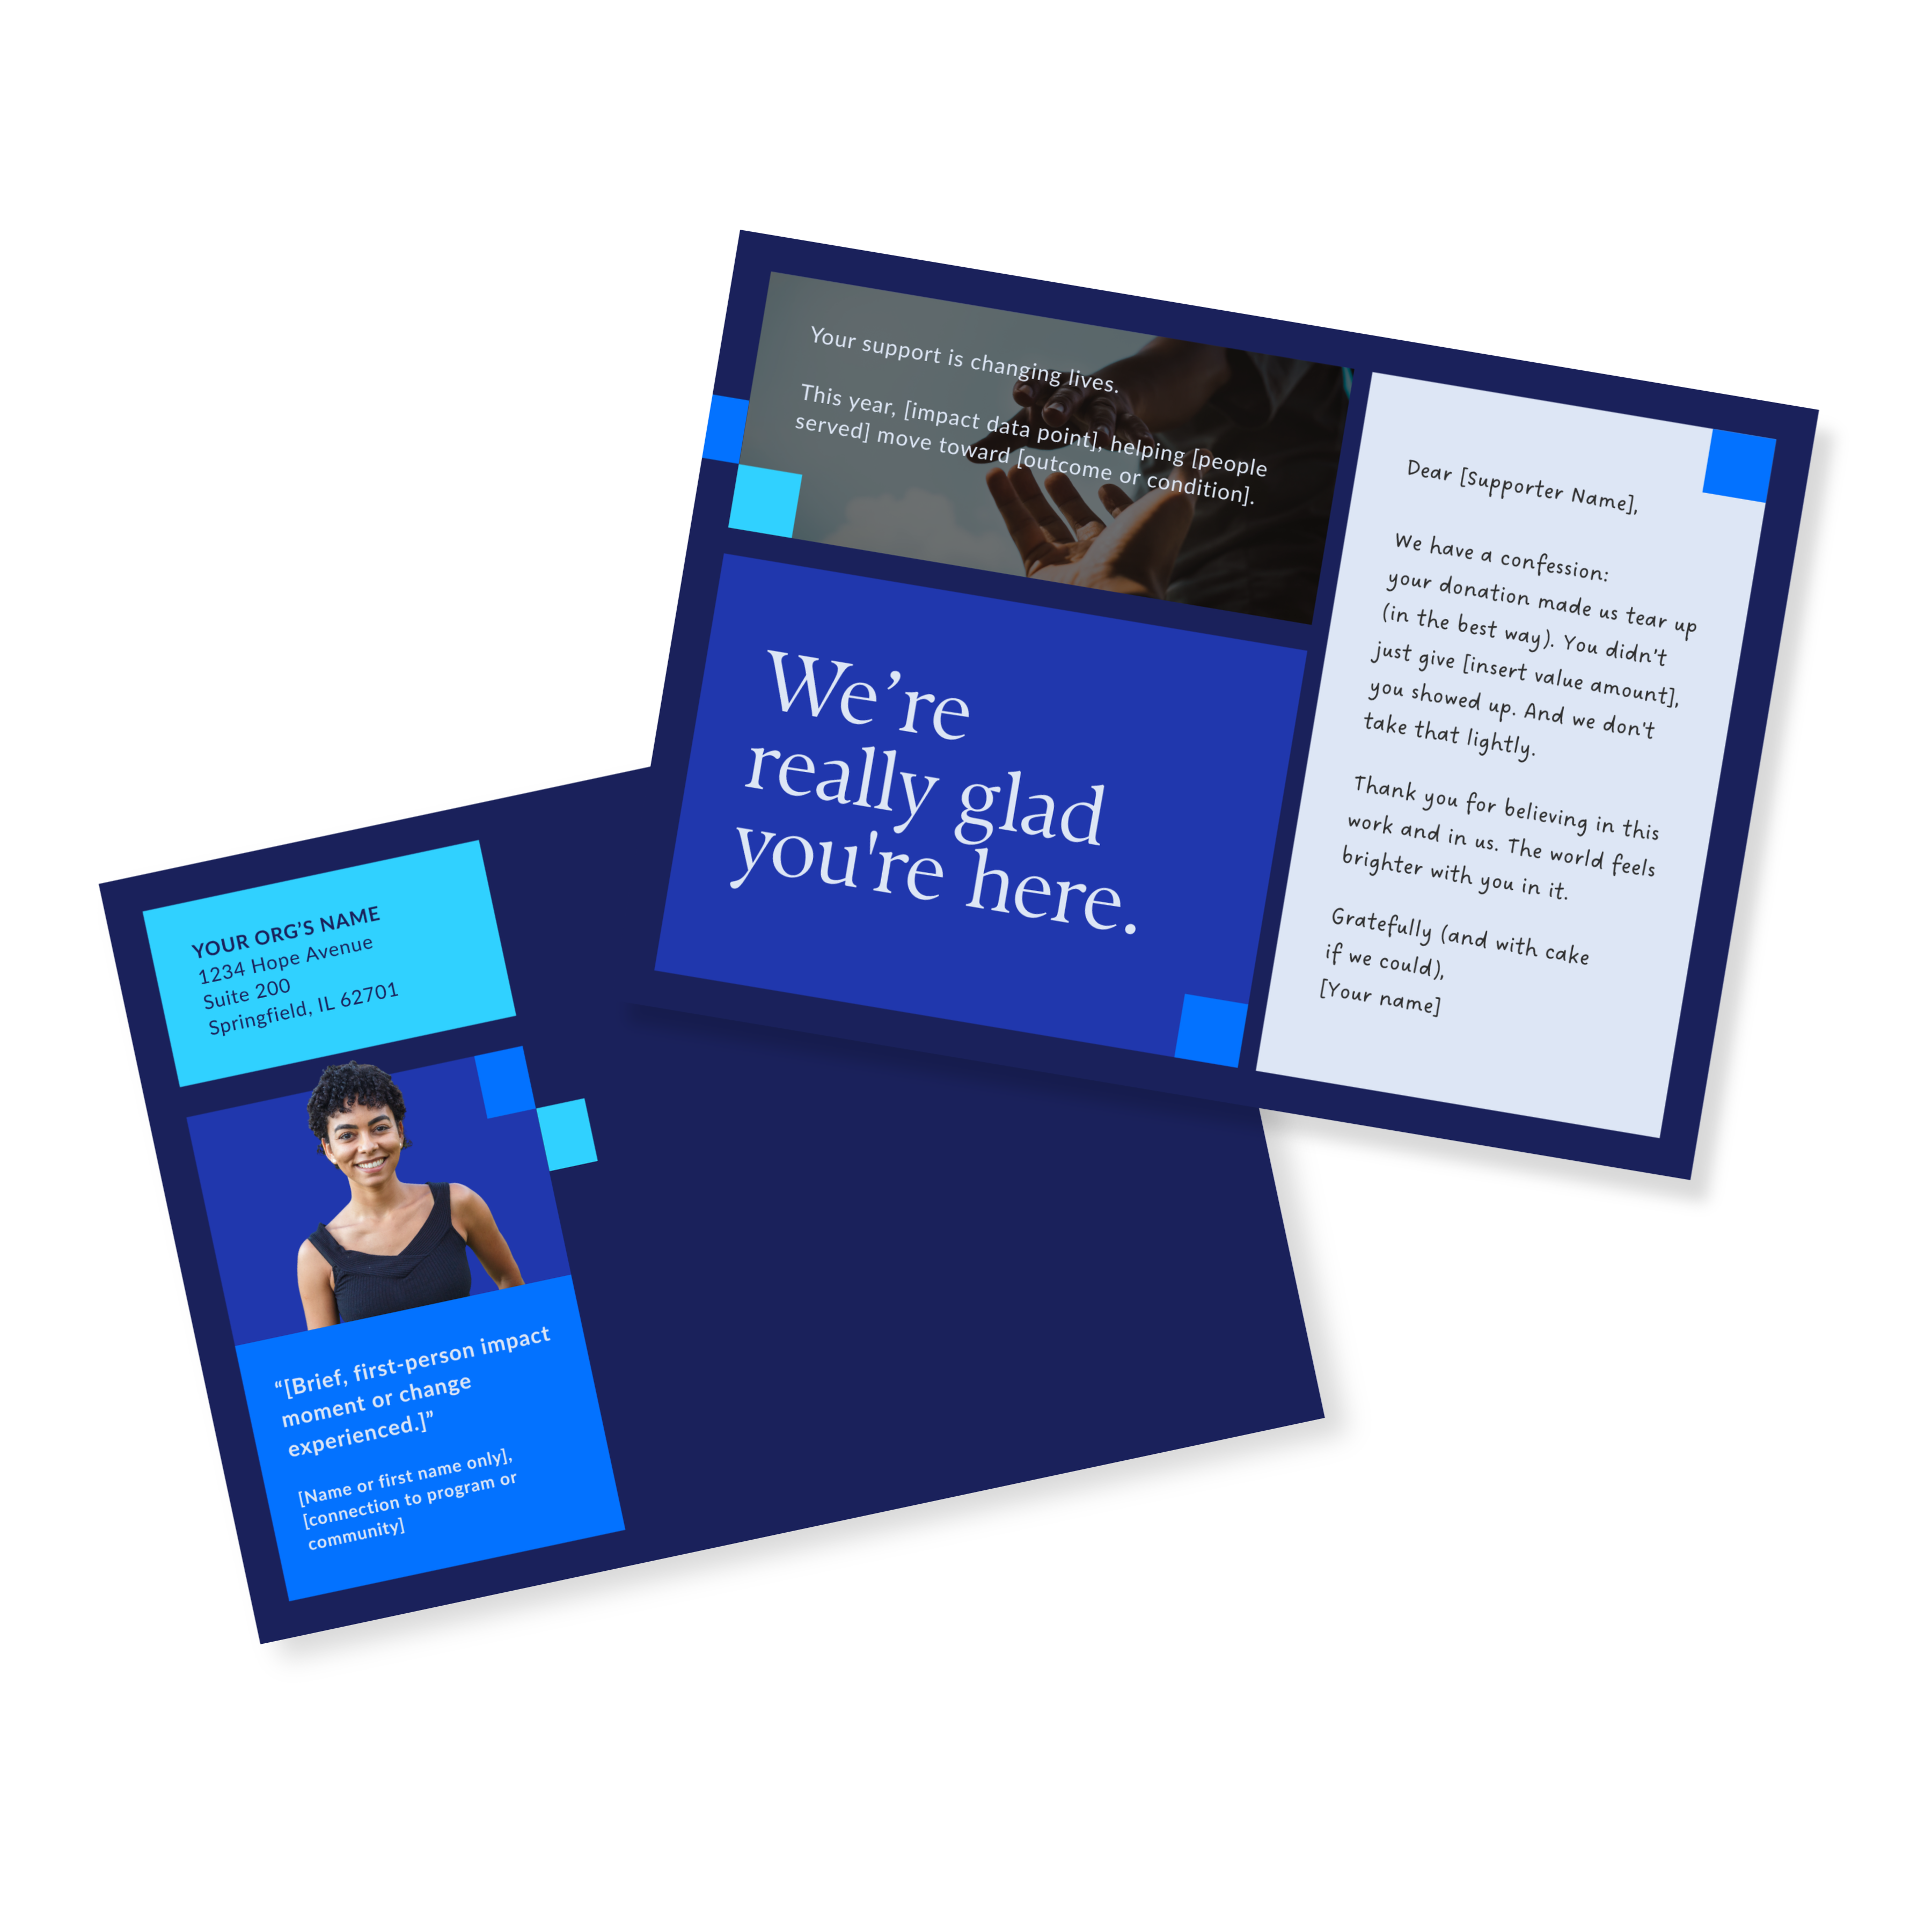
Donor Thank You Postcards Templates
Enter your info and we’ll send the postcards straight to your inbox:
Lesson 5: Every Section of Your Report Should Pass the Donor Filter.
Look at every section, statistic, quote, and photo in your report and ask: why would a donor care about this?
Donors are not interested in a long list of your organization's activities. They want to see how their support made a difference. This is what separates activity-based reporting from impact-based storytelling, and it's what turns a report from informative to genuinely inspiring.
This is usually where the biggest mindset shift happens. Donors aren't just funding programs. They're supporting real change and want to feel like part of something bigger than themselves. Your report should help them feel connected before they even see the numbers.
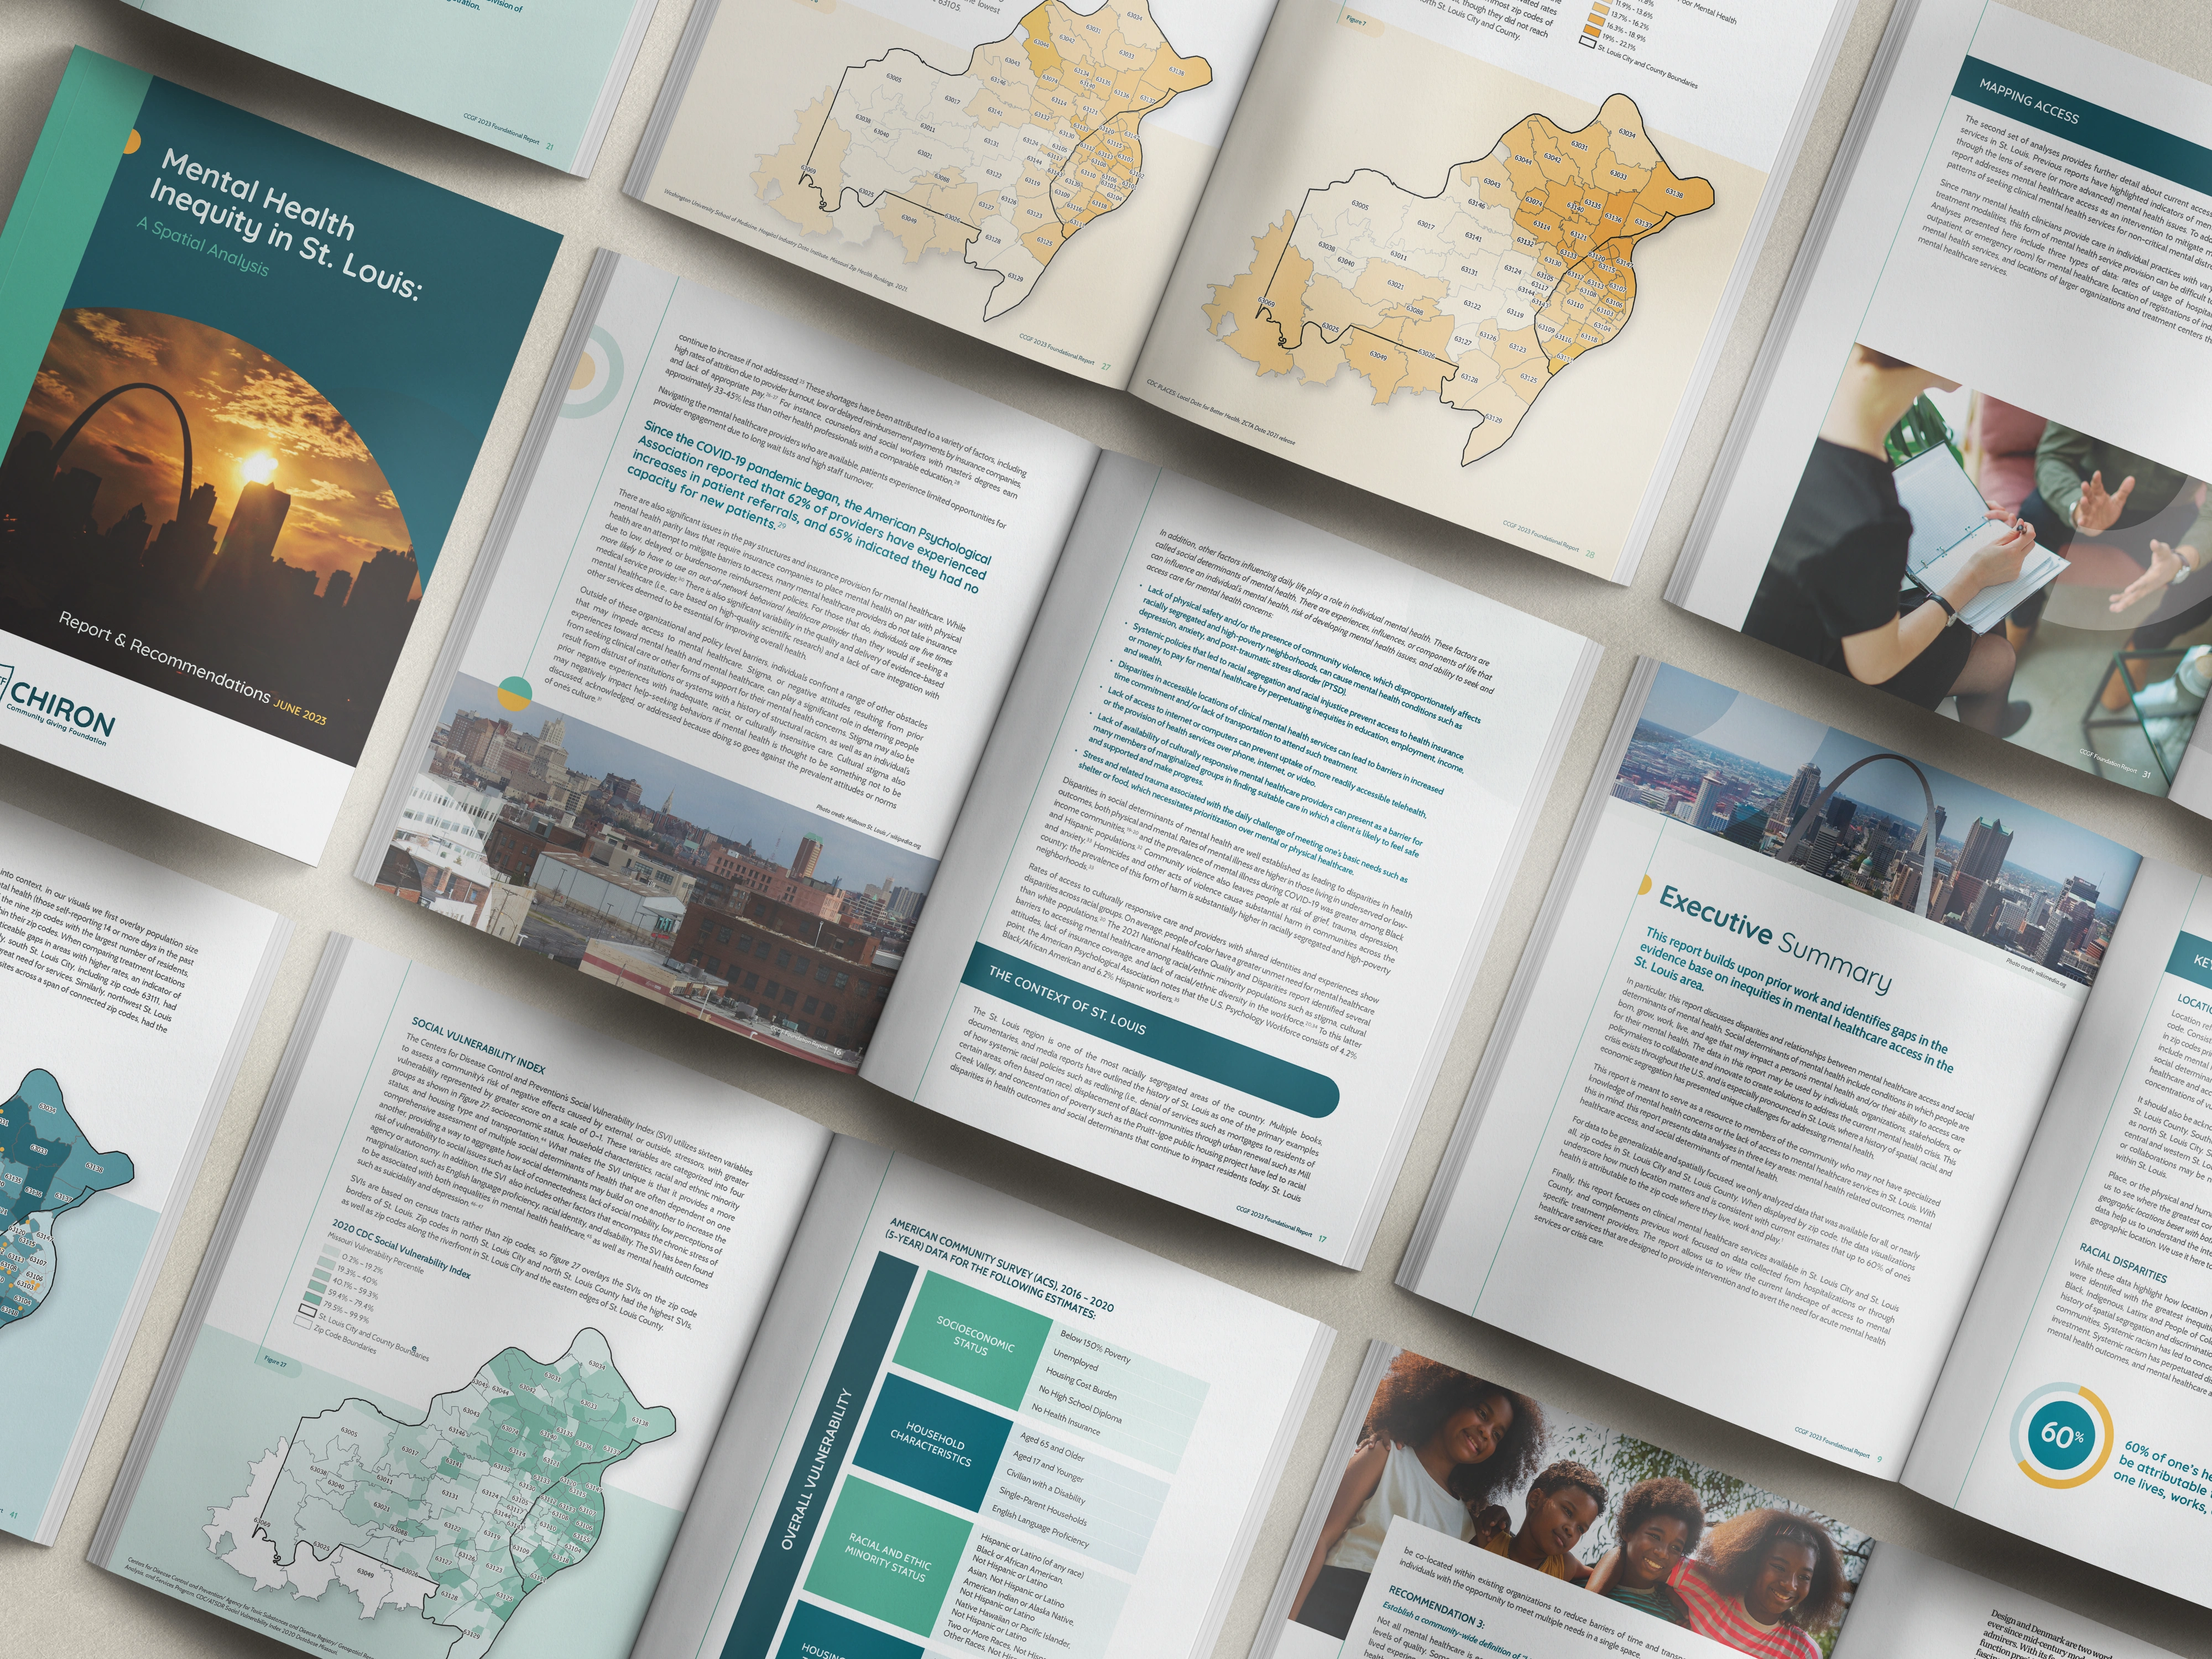
The CEO of Chiron Community Giving Foundation asked us to help make complex mental health research accessible and credible for community partners and policymakers. The challenge: make people care about data they might otherwise scroll past. The result:
"A beautiful job bringing our foundation's report to life. The visualized data and narrative were enhanced..."
—and a report they consistently point to, months later. That's the filter working.
Lesson 6: A Report That Inspires but Doesn't Direct Is a Missed Opportunity.
If your annual report builds to a moment of real connection… and then just ends, you've left money on the table. And I mean that literally.
Think about what you want donors to do after reading. Give again? Increase their gift? Share it with someone? Tell them. Clearly, directly, with a button or a link or a QR code that makes it impossible to wonder what the next step is.
When donors feel inspired but aren't given direction, they close the PDF and move on with their day. They did care, but you didn’t show them how to express their concern.
The CEO of Colorwave asked us to redesign their fundraising deck because board visibility was on the line. Making the call to action unmissable made all the difference:
"The end product received rave reviews from our team and Board leadership."
Make one clear request. That's it. Don't make them guess.
Lesson 7: The Real Cost of the Wrong Designer Is the Redo.
Many orgs come to me after first trying a freelancer or a generalist designer. The work they got was pretty hit or miss… but mostly just miss.
Maybe the report looked finished, but it didn't reflect who they are. It didn't connect with readers. And now they're starting over with less time, less budget, and less confidence in the process.
That's the real cost of choosing the cheapest option. Not just the invoice, but the redo. (And the dread of telling your ED you need to start over six weeks before launch.)
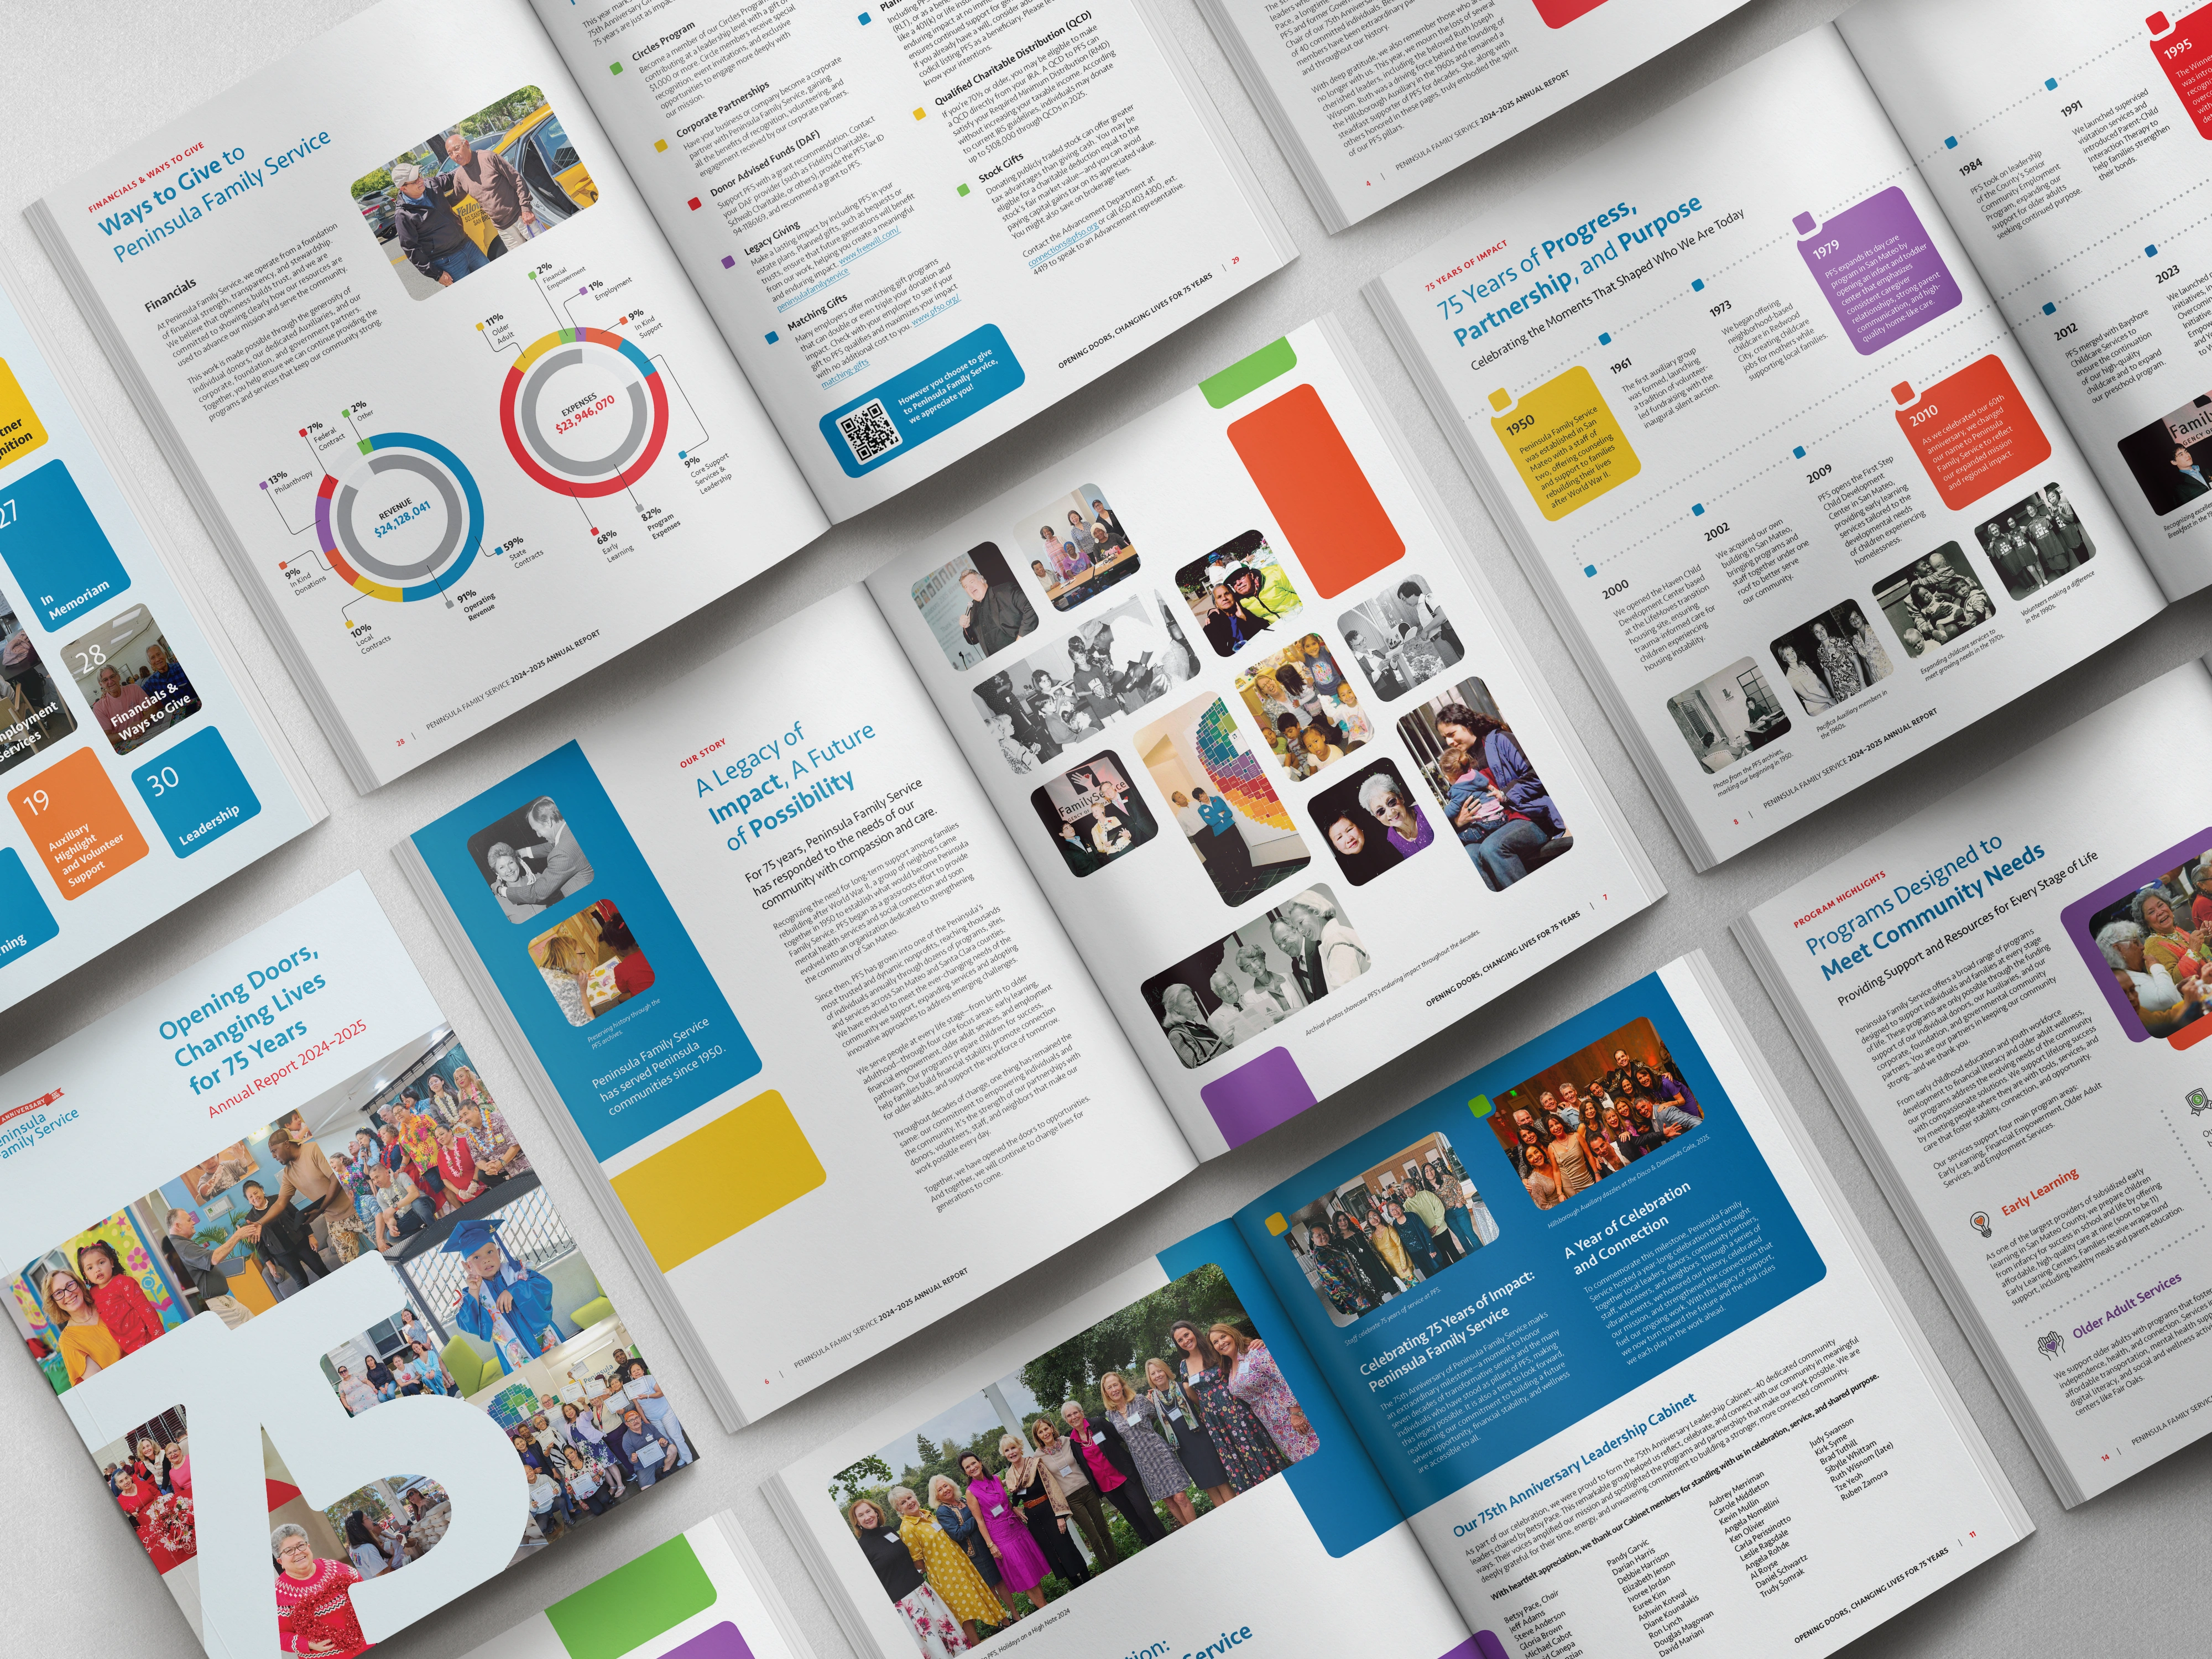
Annual report design isn't general design work. It combines donor psychology, mission translation, and visual storytelling in one high-stakes document. A generalist can make it look professional. That's not the same as making it build belief.
Orgs that invest in the right expertise from the start don't just get a better report. They get their time back. And honestly, that might be the bigger win.
Ready to hand this off?
The Annual Report Design Intensive is your report, done for you. Narrative strategy first, design second, so the finished piece doesn't just recap your year... it makes people believe in it.
You bring the impact. We'll make it impossible to skim past.