"Working in partnership with Acton Circle has been a wonderful experience. Olivia and the team are extremely talented and have crafted amazing collateral for my organization, East Bay Community Foundation. Working with them has been a smooth process from initial project intake to final design delivery. One highlight of working with Acton Circle is their excellent facilitation of strategy meetings. They thoroughly capture all the information needed and make translating project needs into a design look like magic."
Michele J.
Marketing Associate, East Bay Community Foundation
"Olivia was wonderful to work with and we were very pleased with the end-product. Highly recommend!"
Alissa T.
Senior Associate Director, University of Michigan School of Information
"A beautiful job bringing our foundation's report to life. The visualized data and narrative were enhanced by the very professional graphic design services provided by Acton Circle."
Kris L.
President + CEO, Chiron Community Giving Foundation
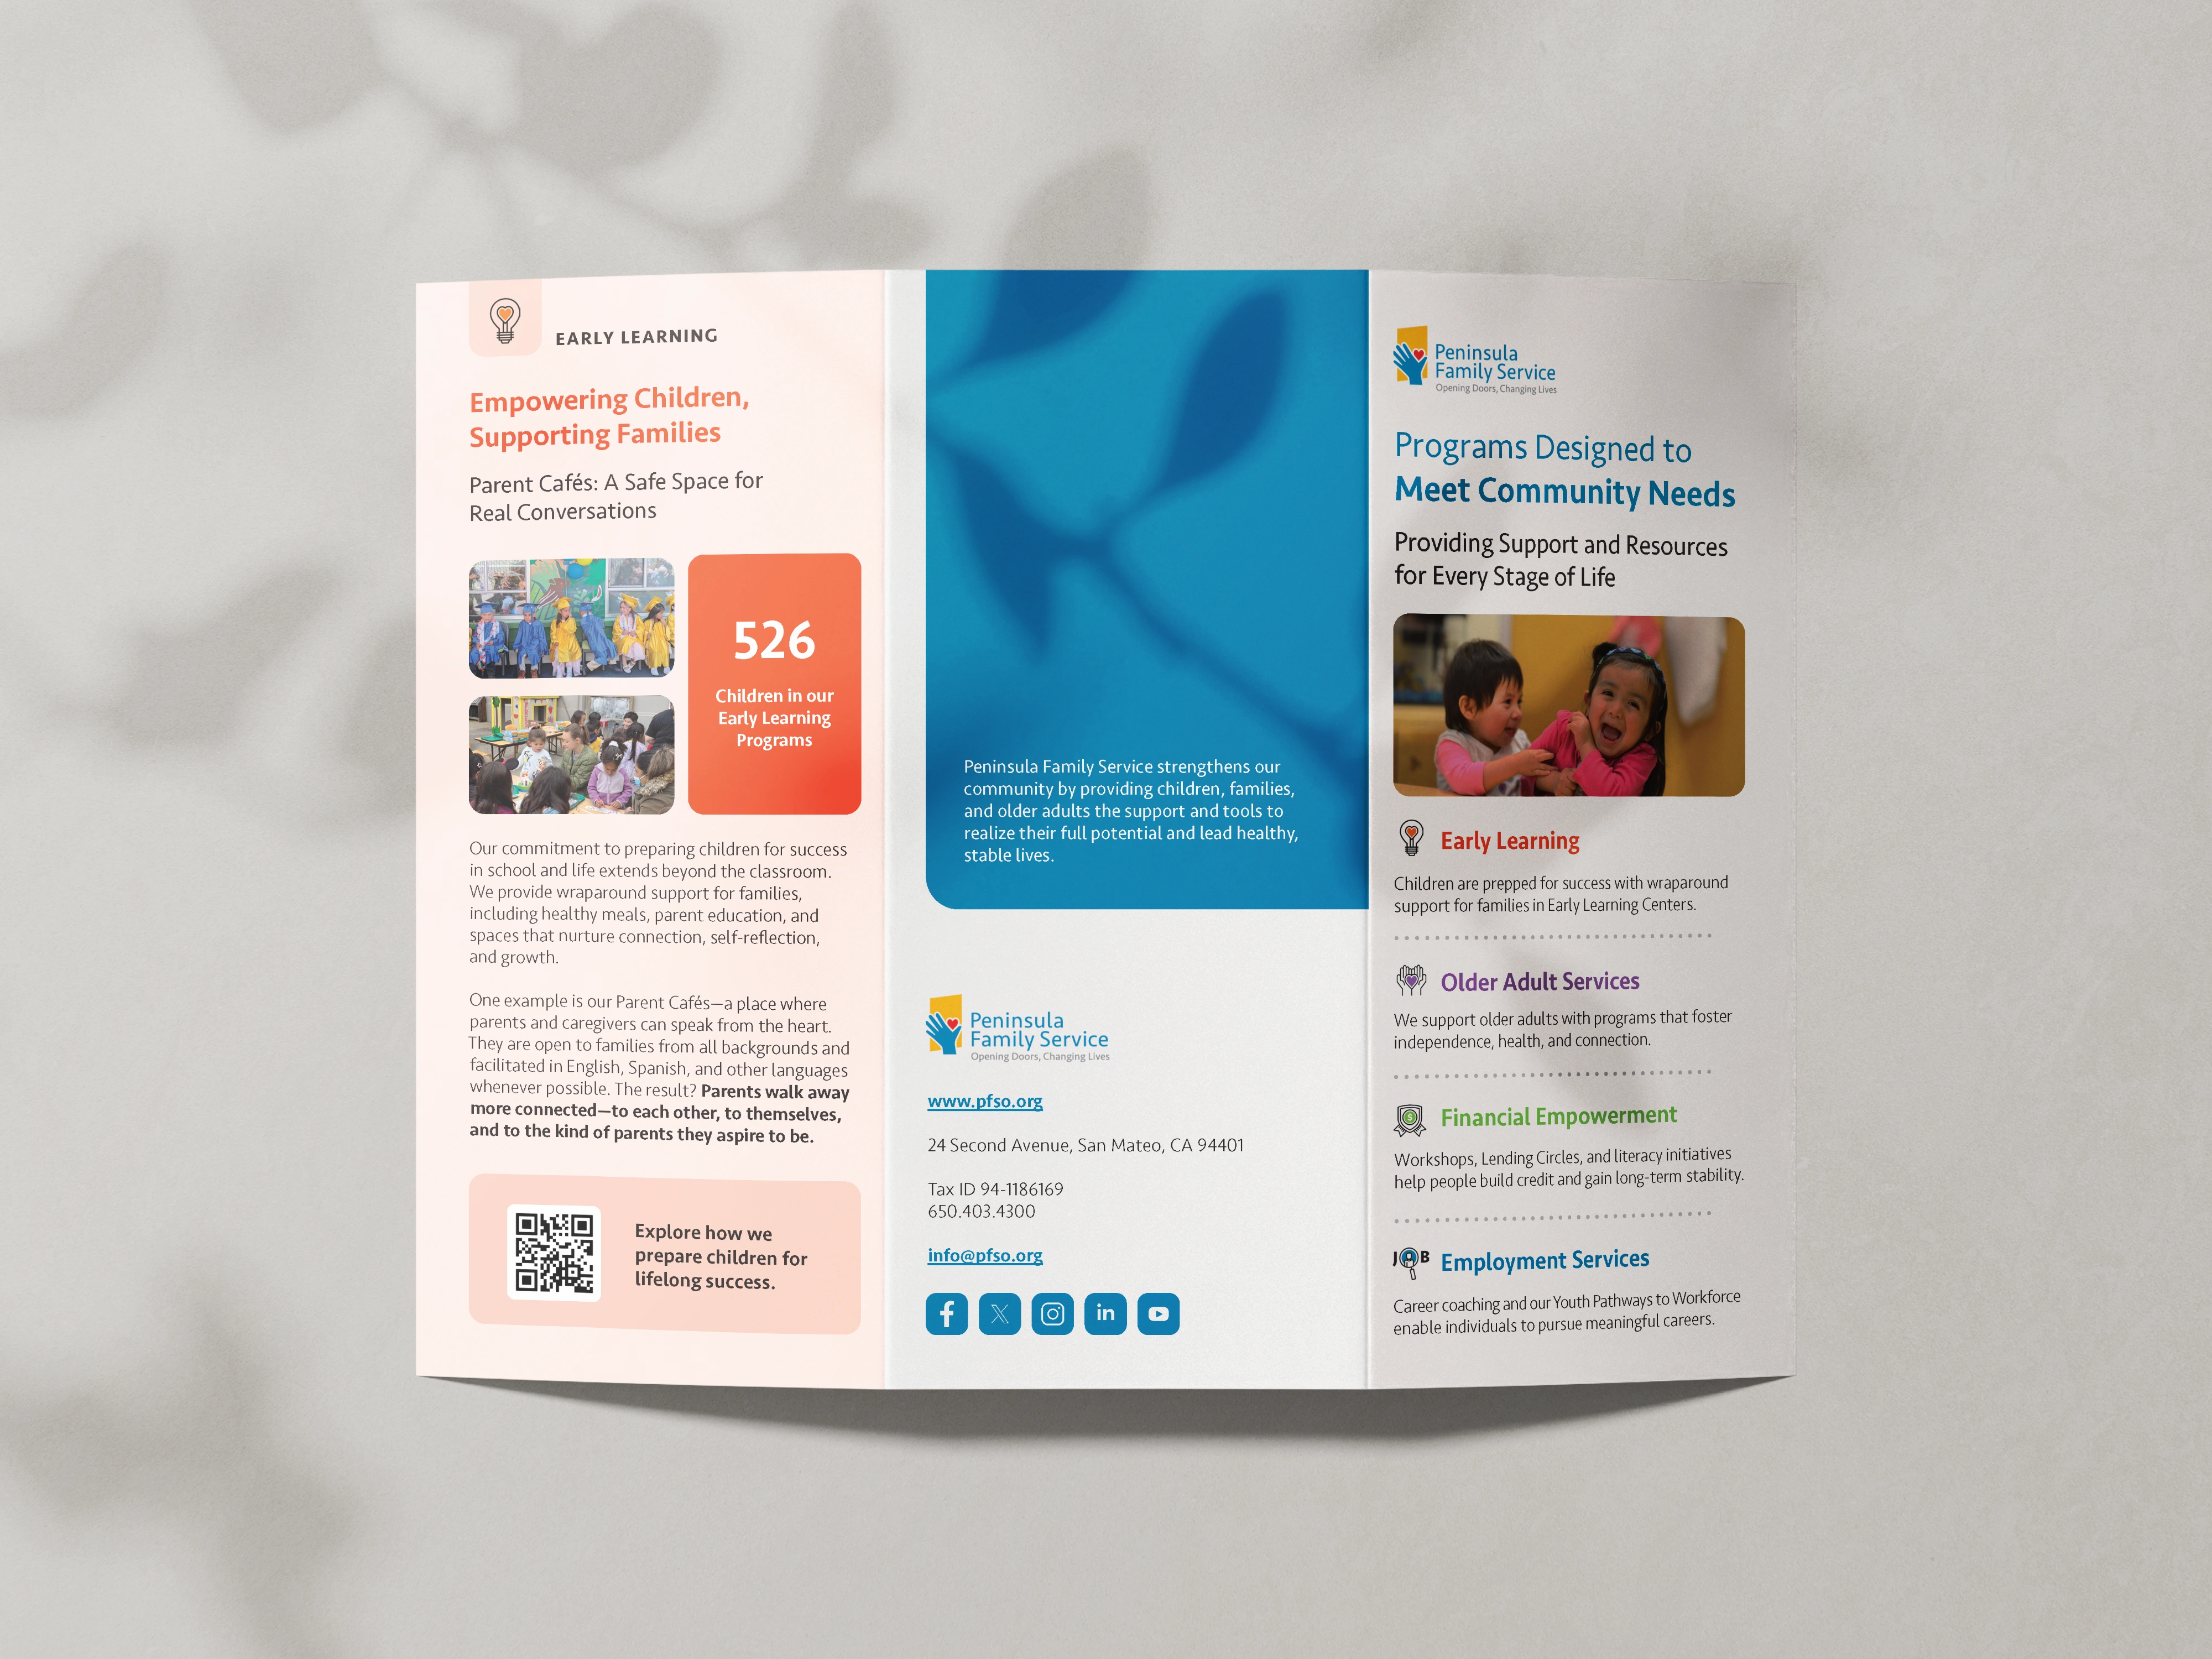
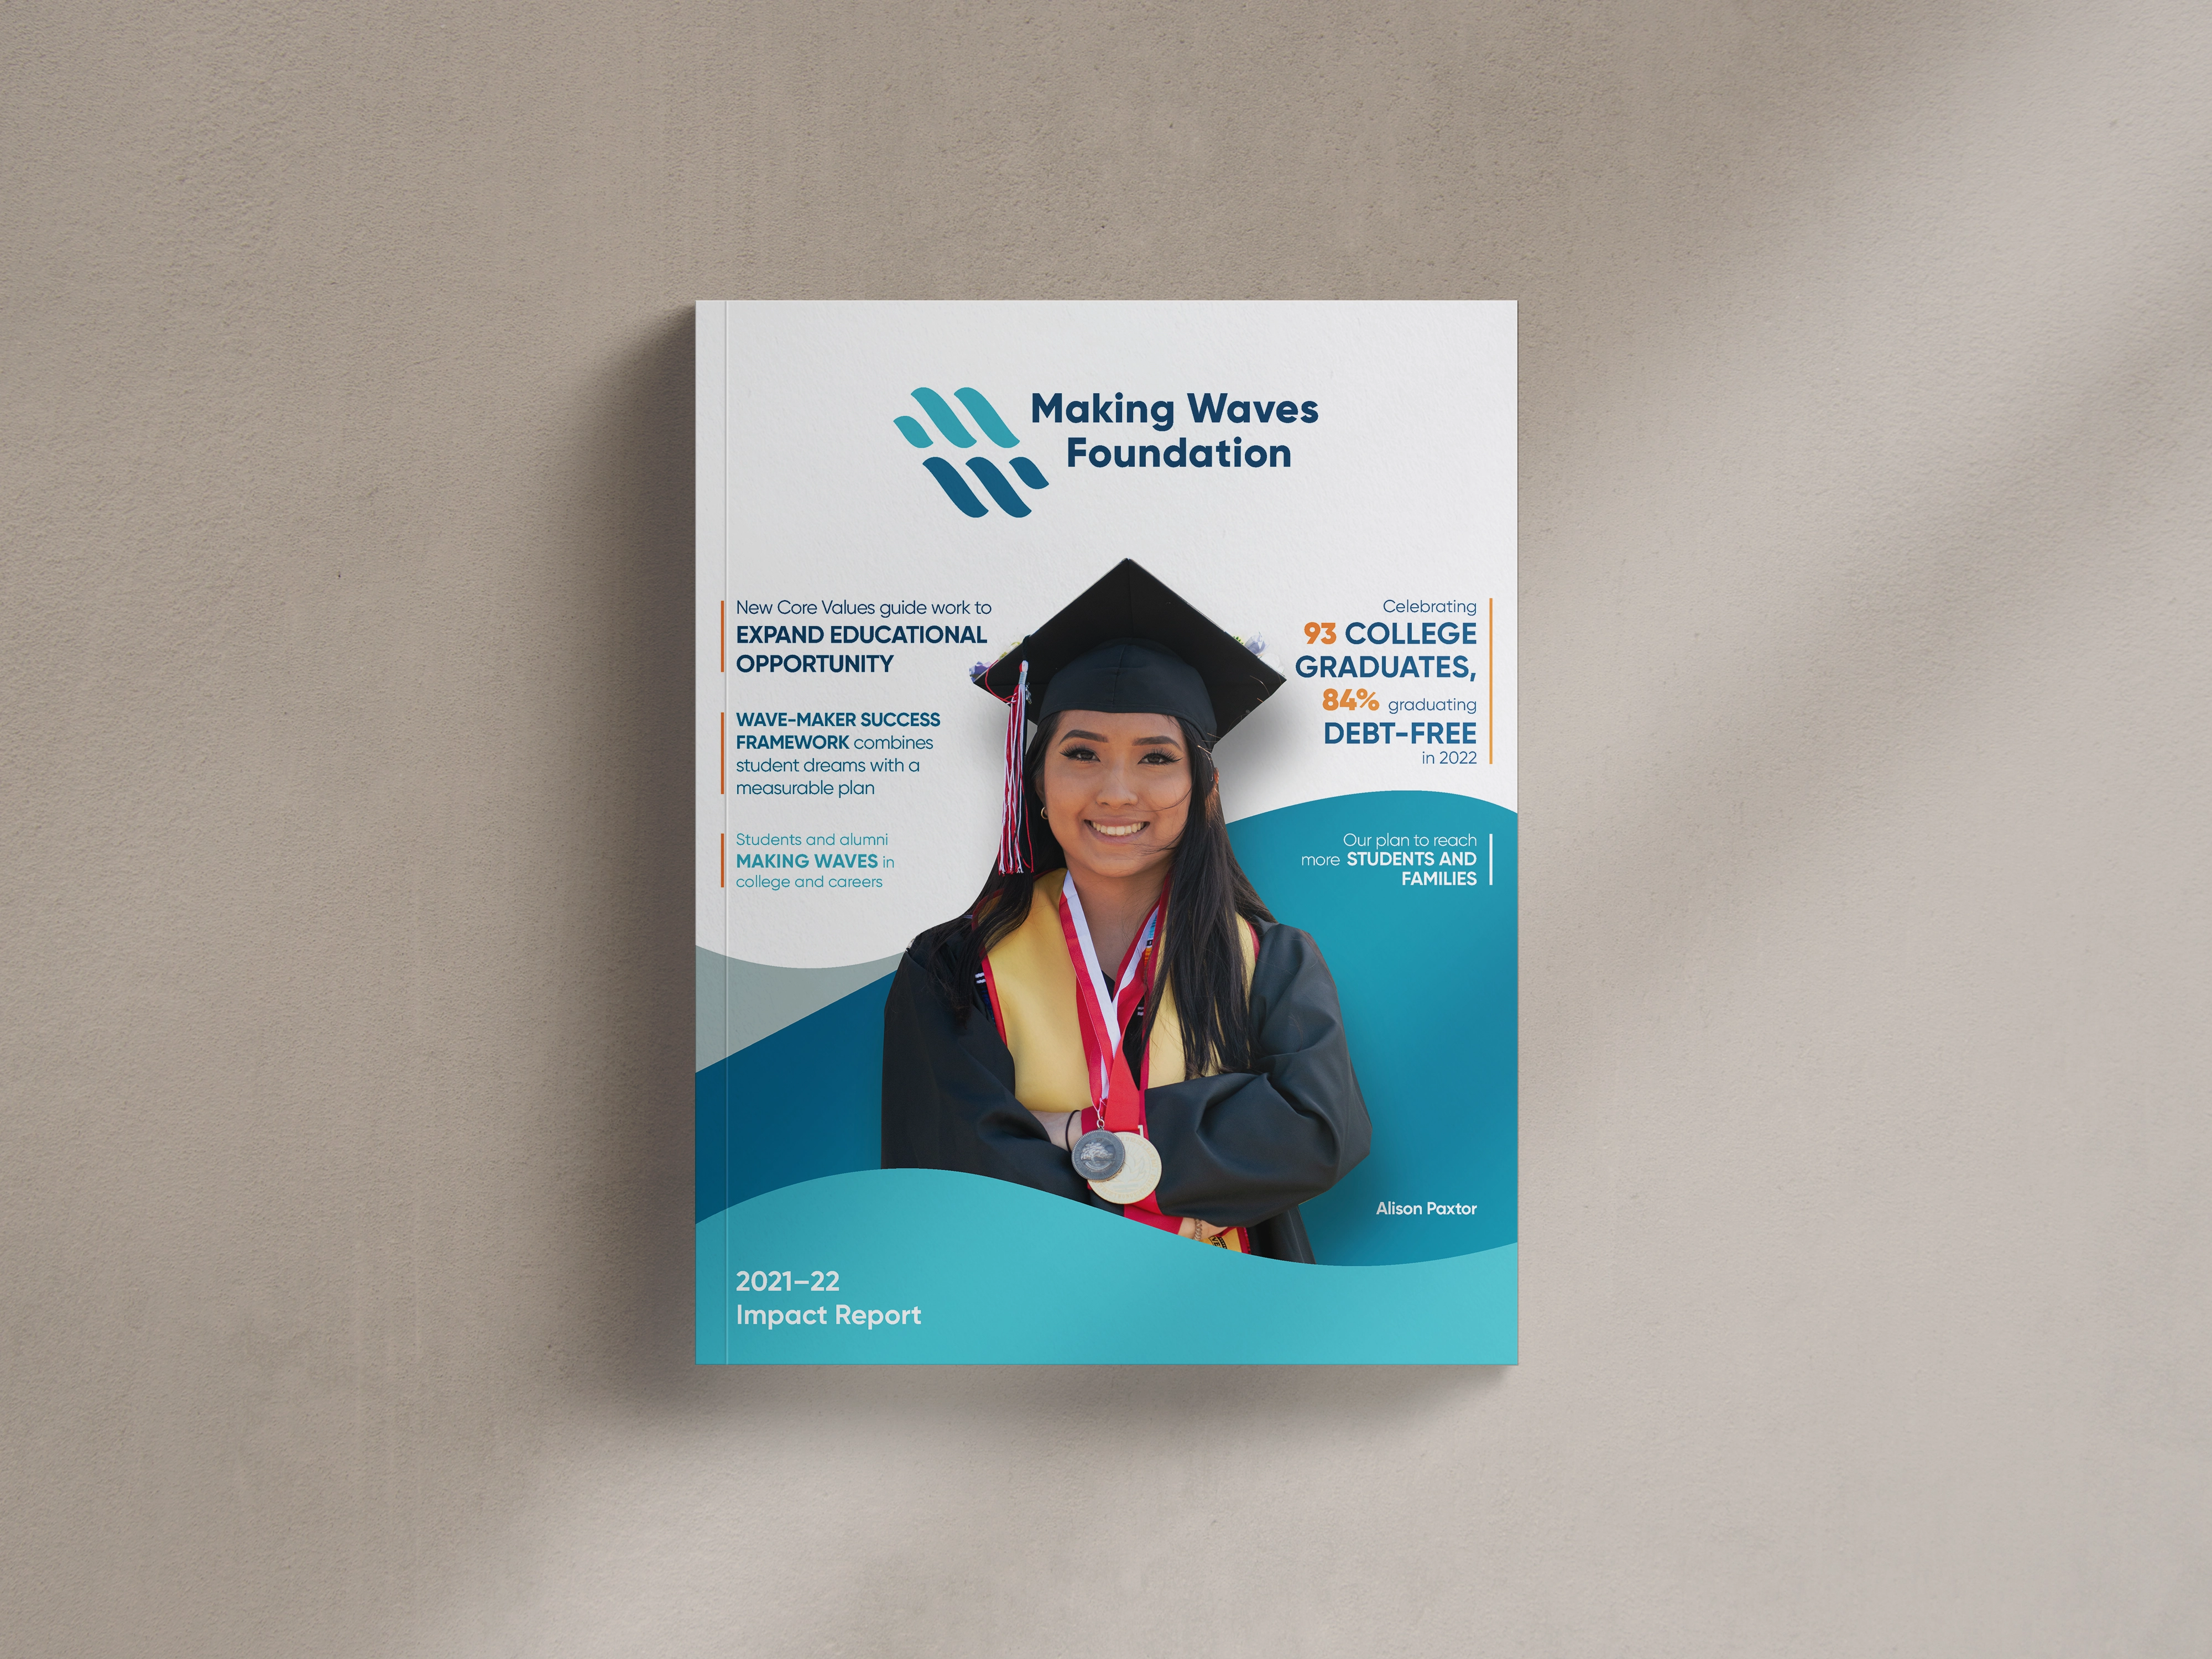
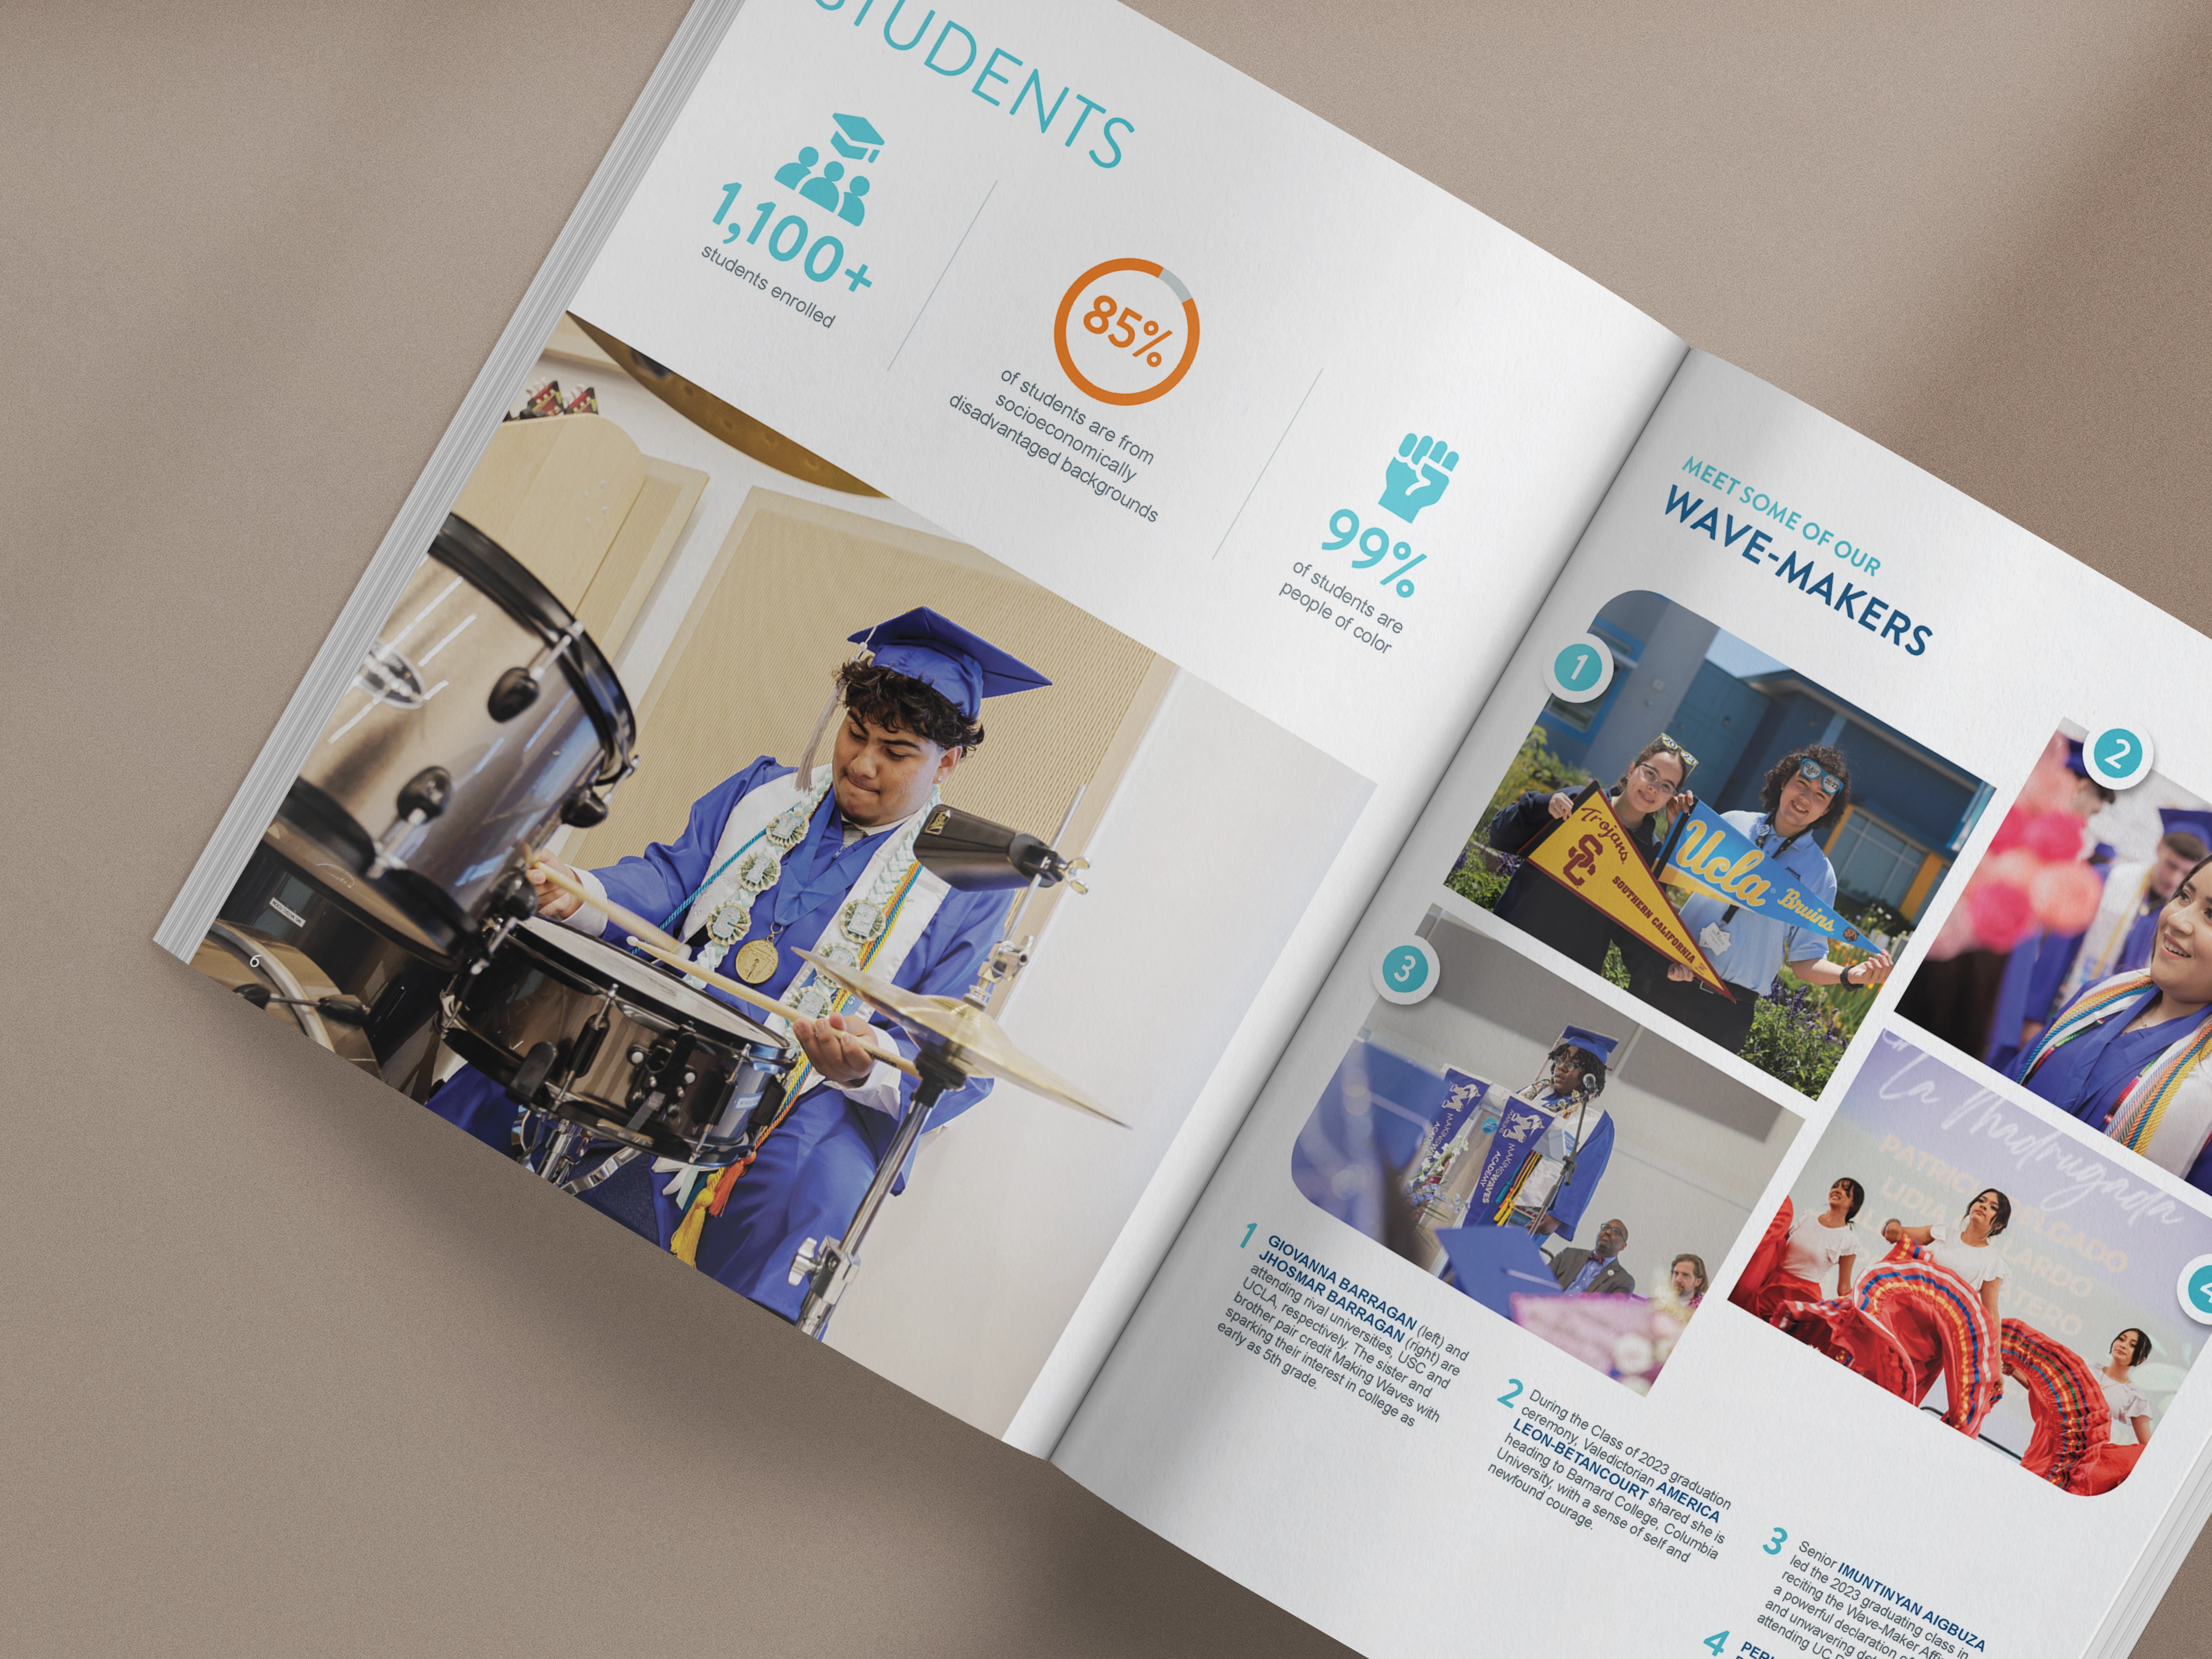
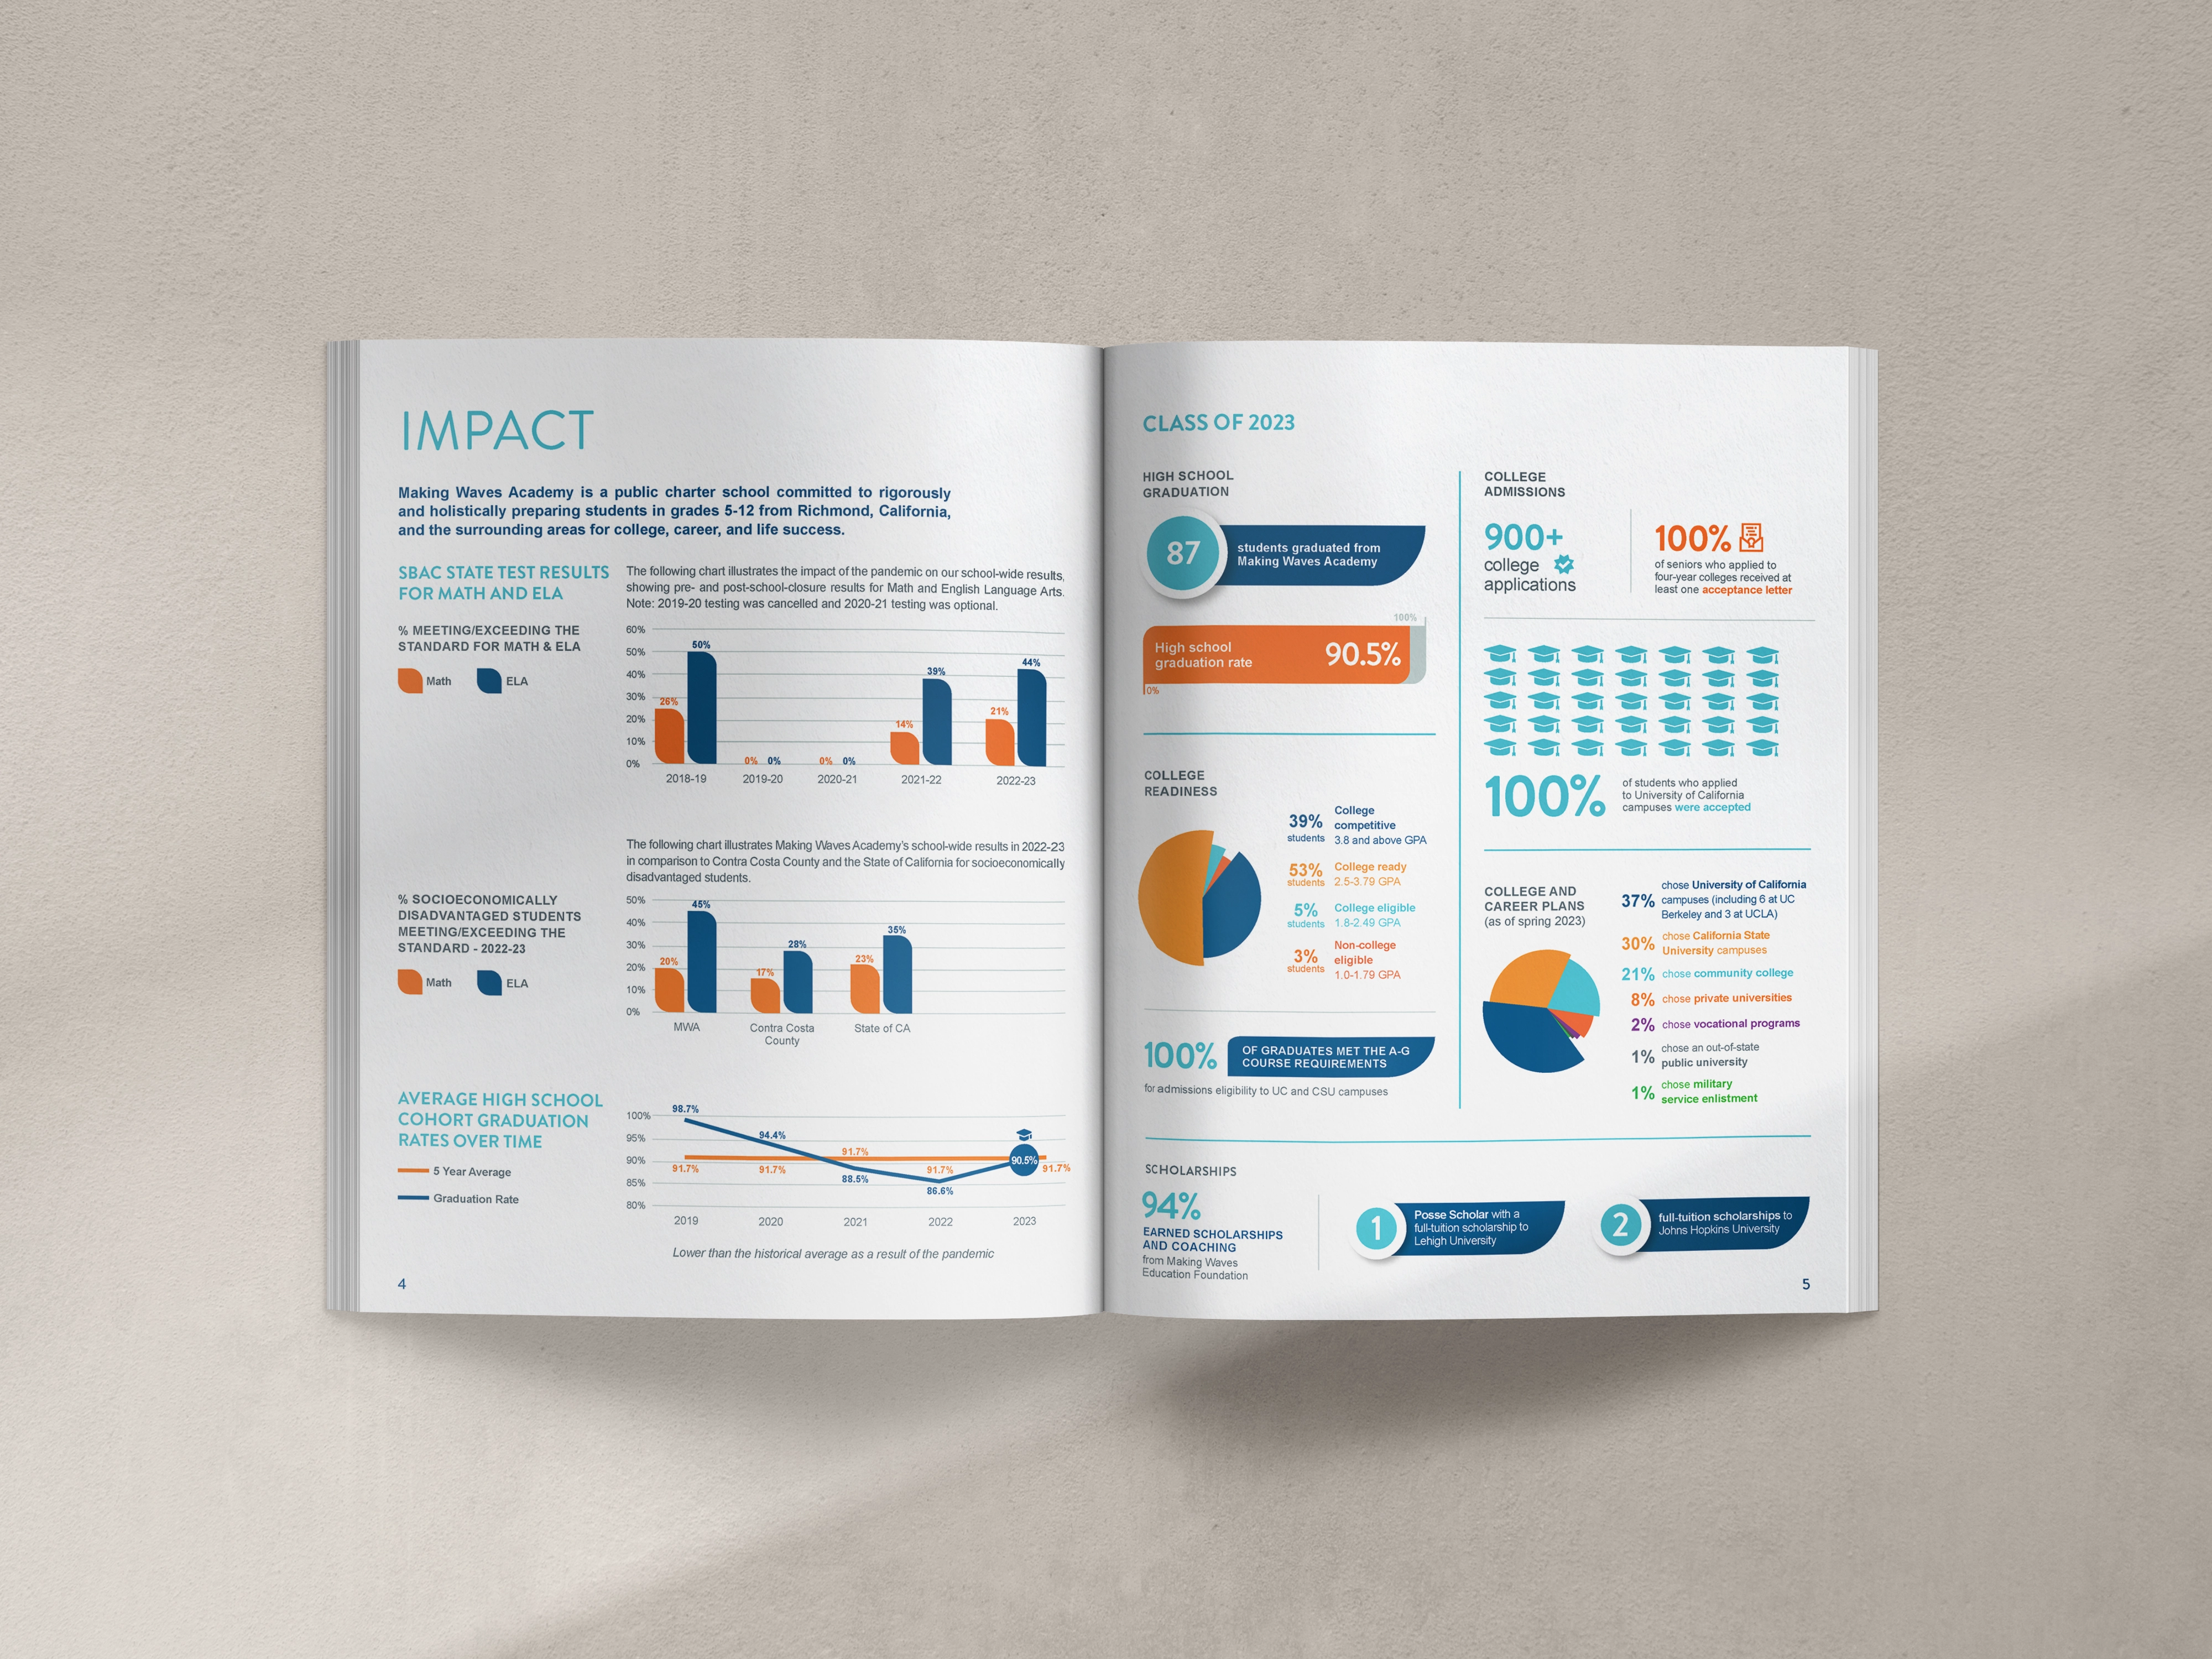
Working with Olivia at Acton Circle was a wonderful professional and personal experience. Her rare combination of marketing skill, insightful ideas, great patience, and playful interaction made the process successful and enjoyable. I had a lot of pressure on my end from many colleagues to get a great product in a certain time frame. My work with Olivia eliminated my stress and created a great plan and product. I don't have to think about who I will use in the future — it will be Acton Circle!
Matthew S.
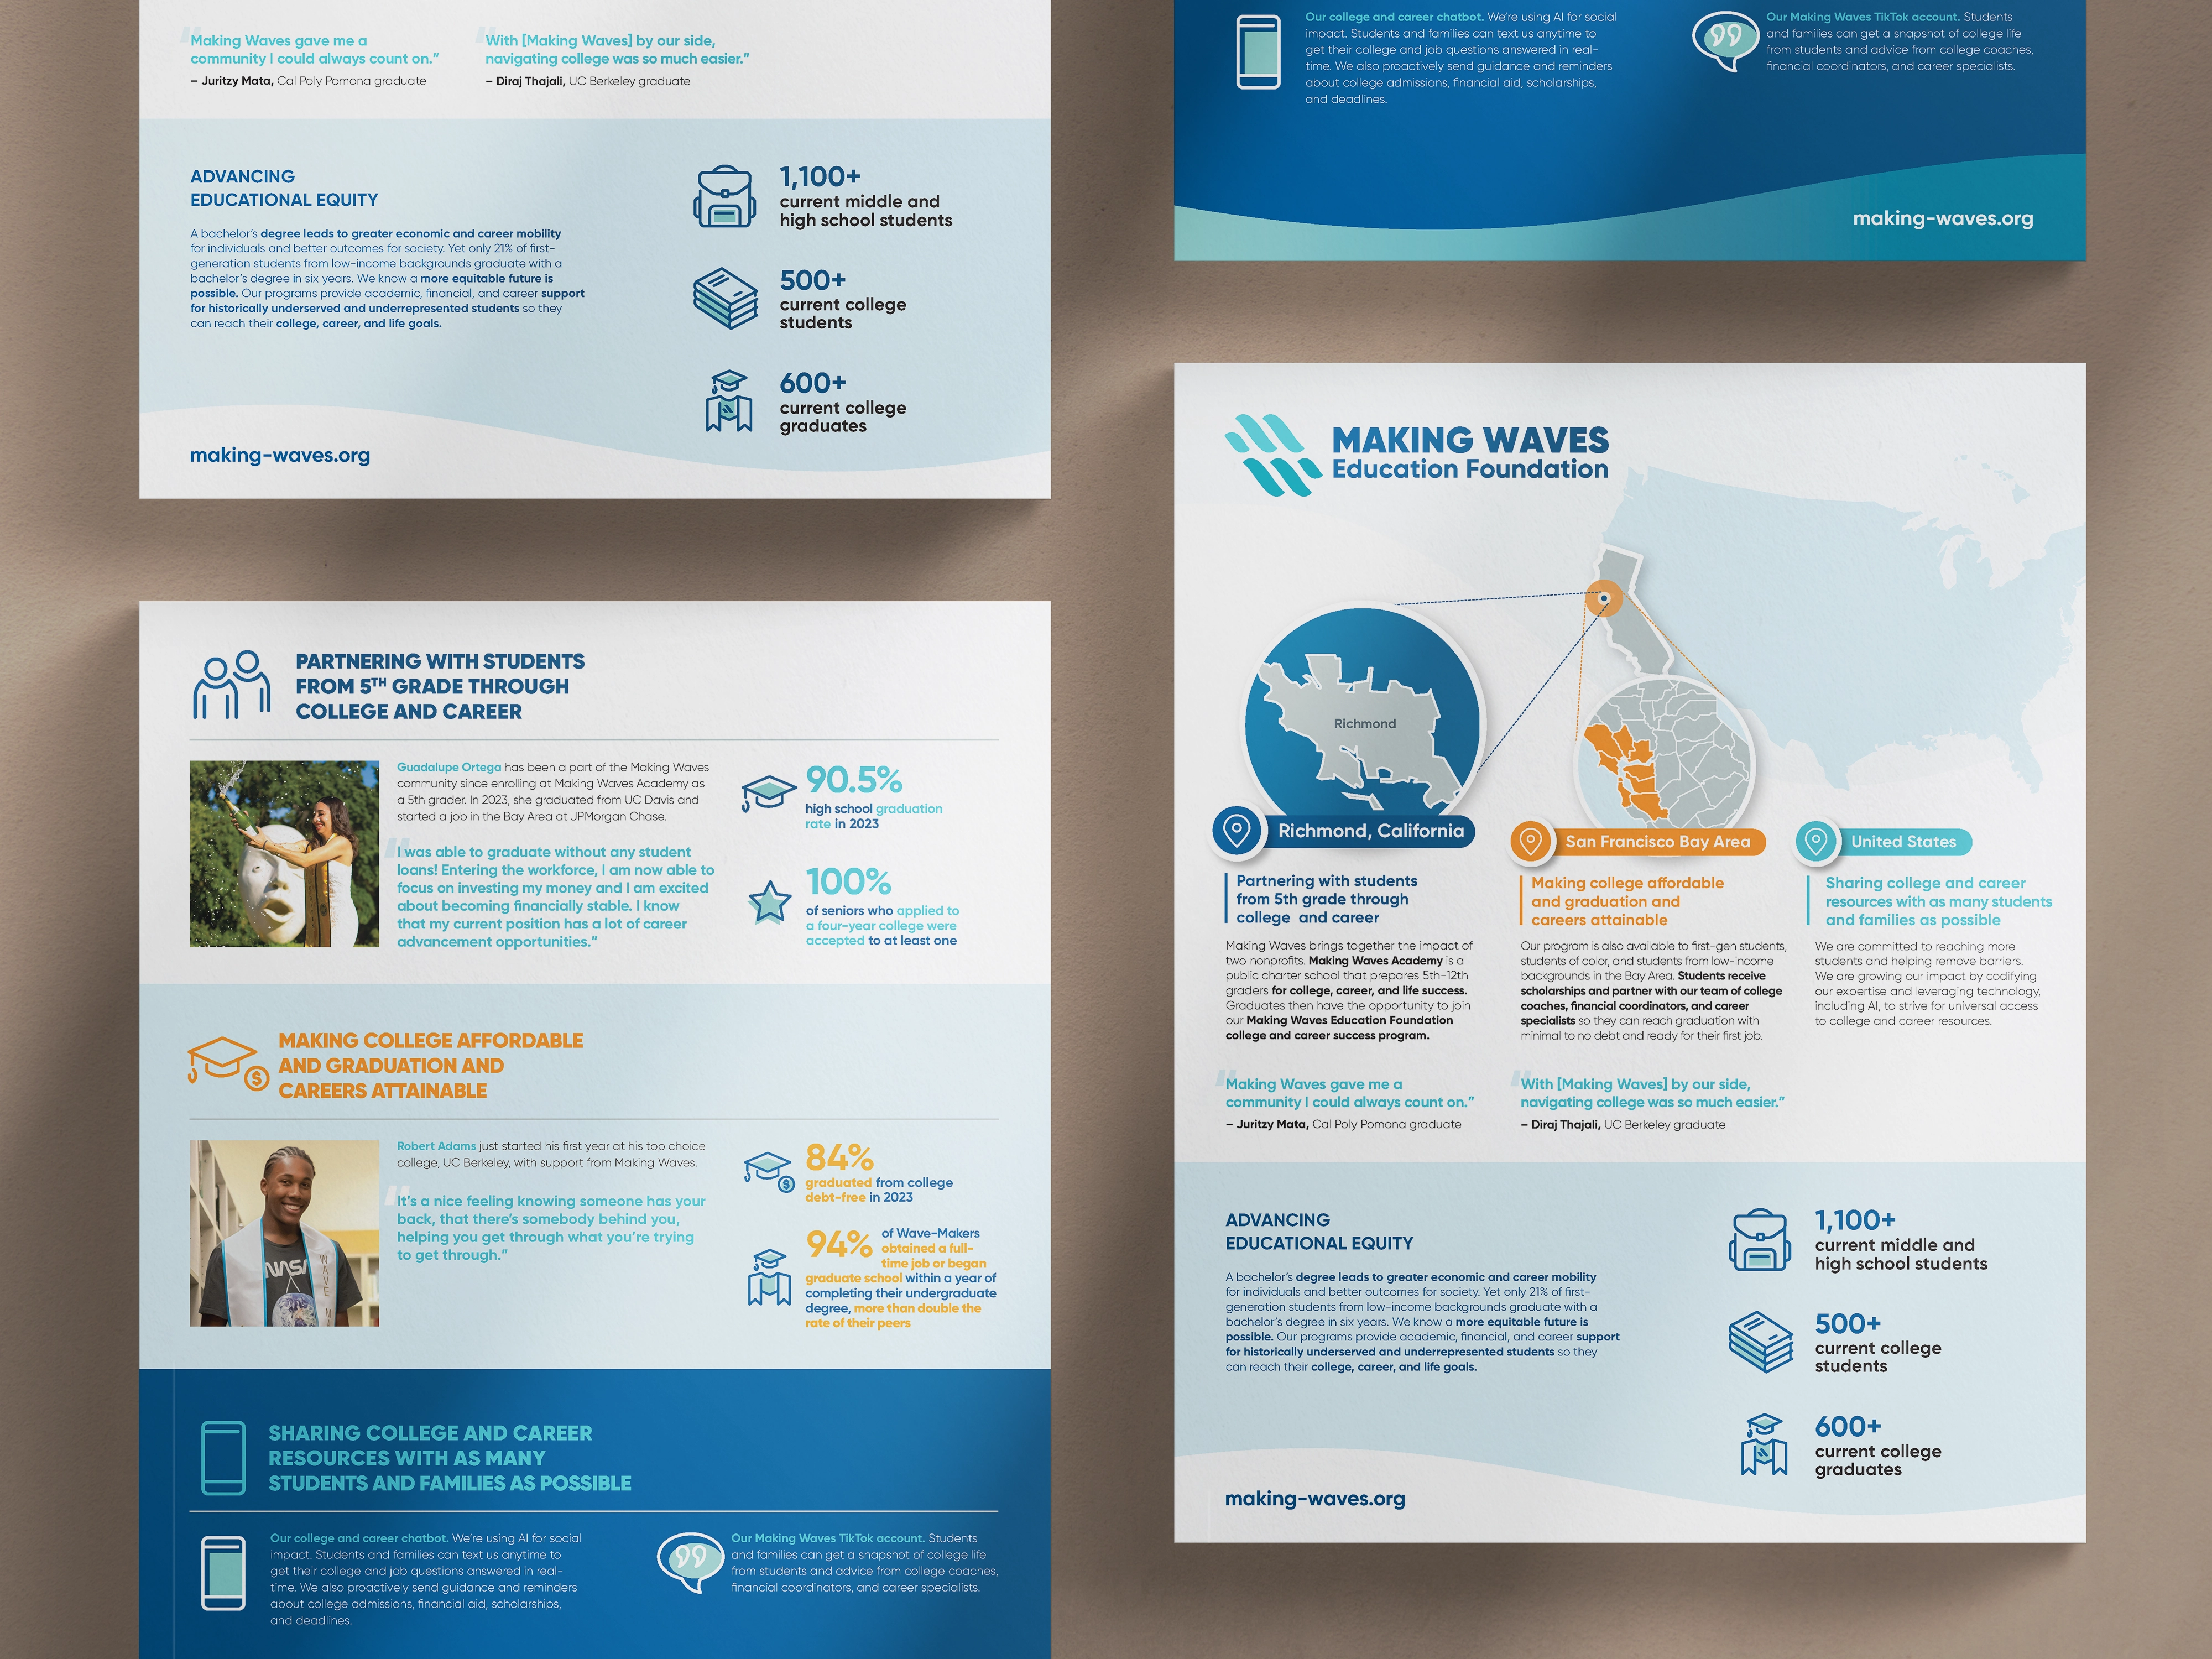
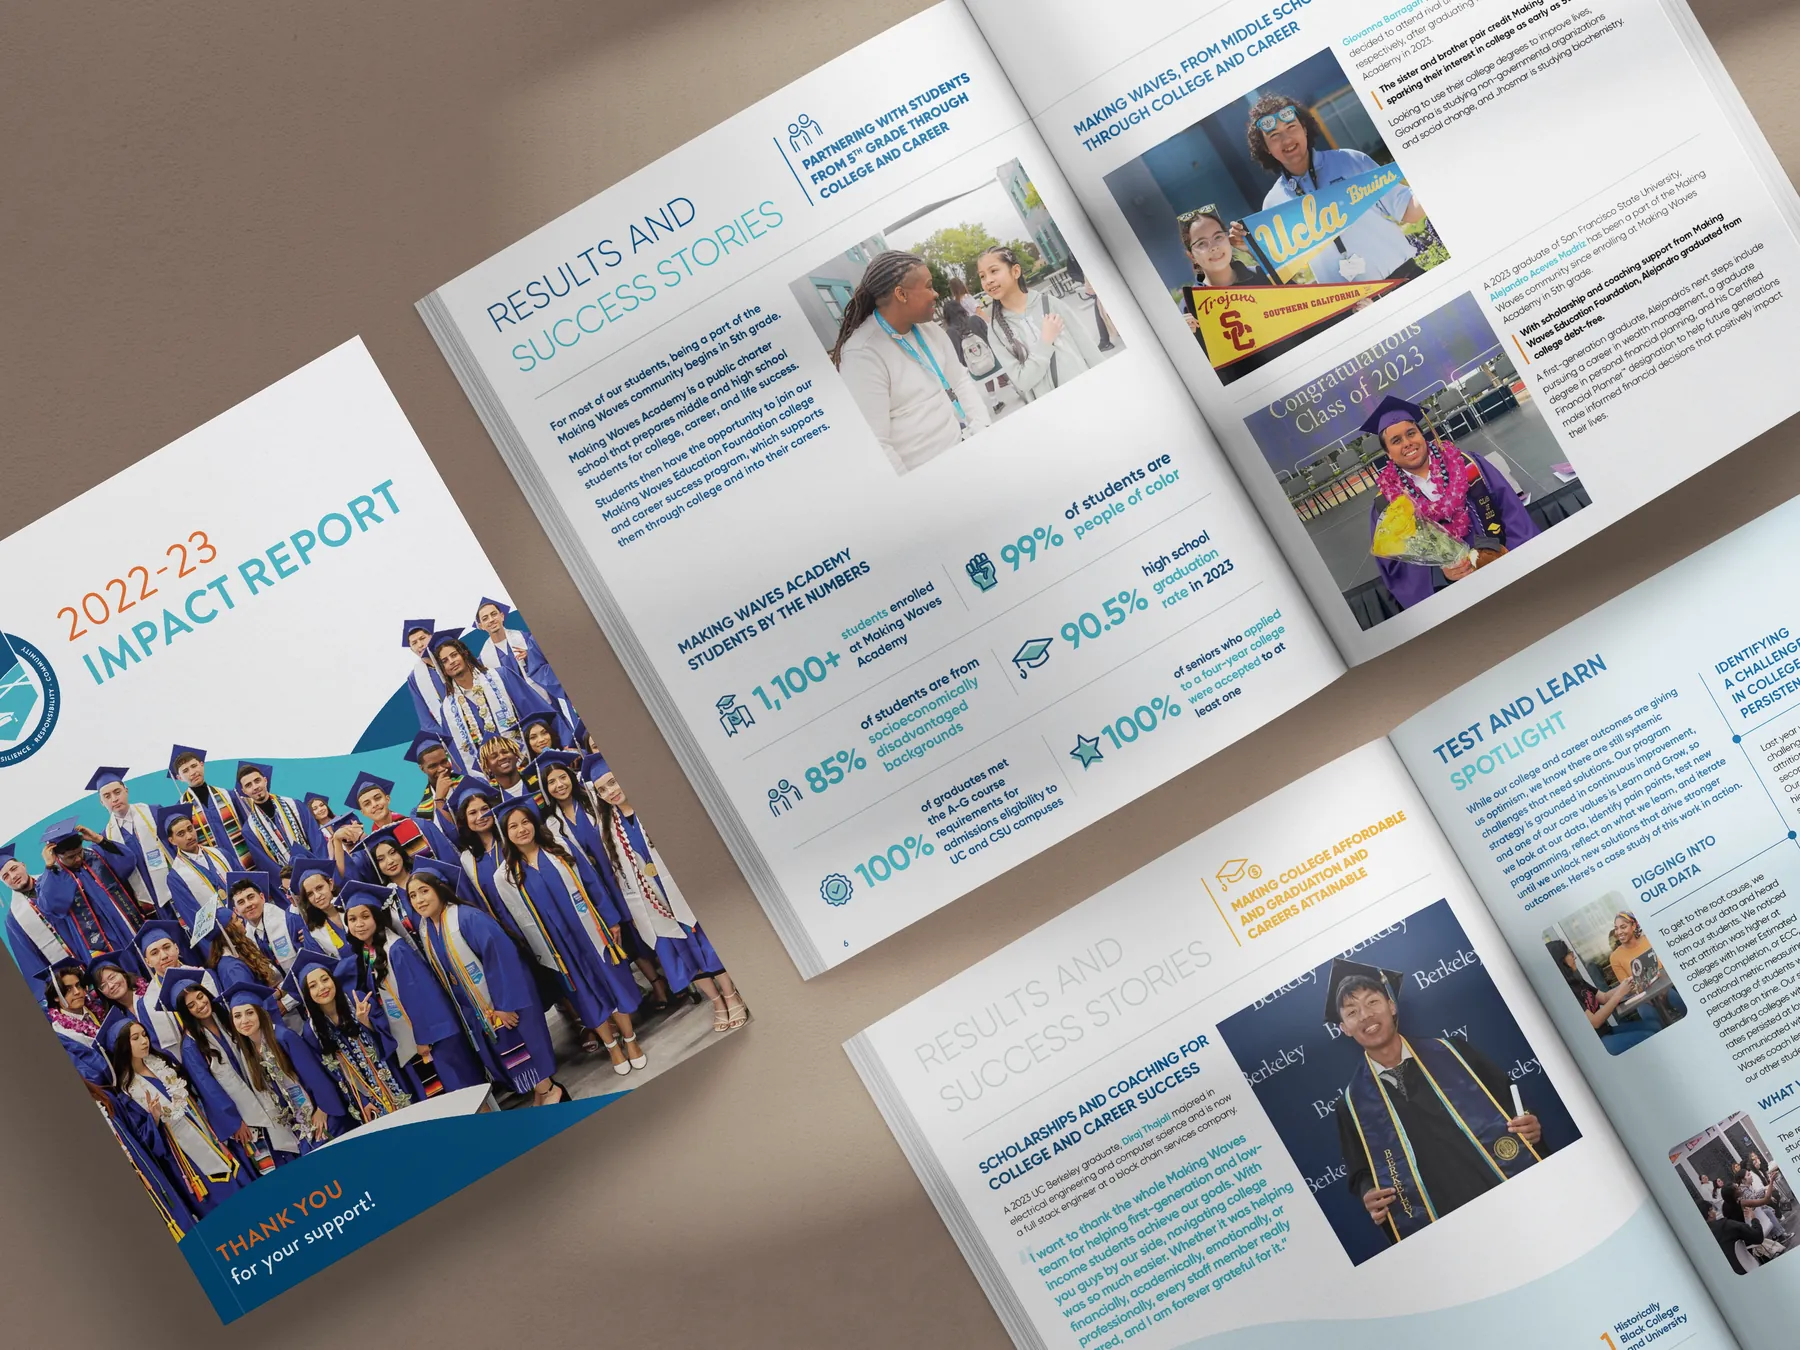
Operations Manager, Making Waves Academy
"Olivia is extremely bright and had incredible ideas and insights for our project. Team was very responsive and easy to work with."
Jenny S.
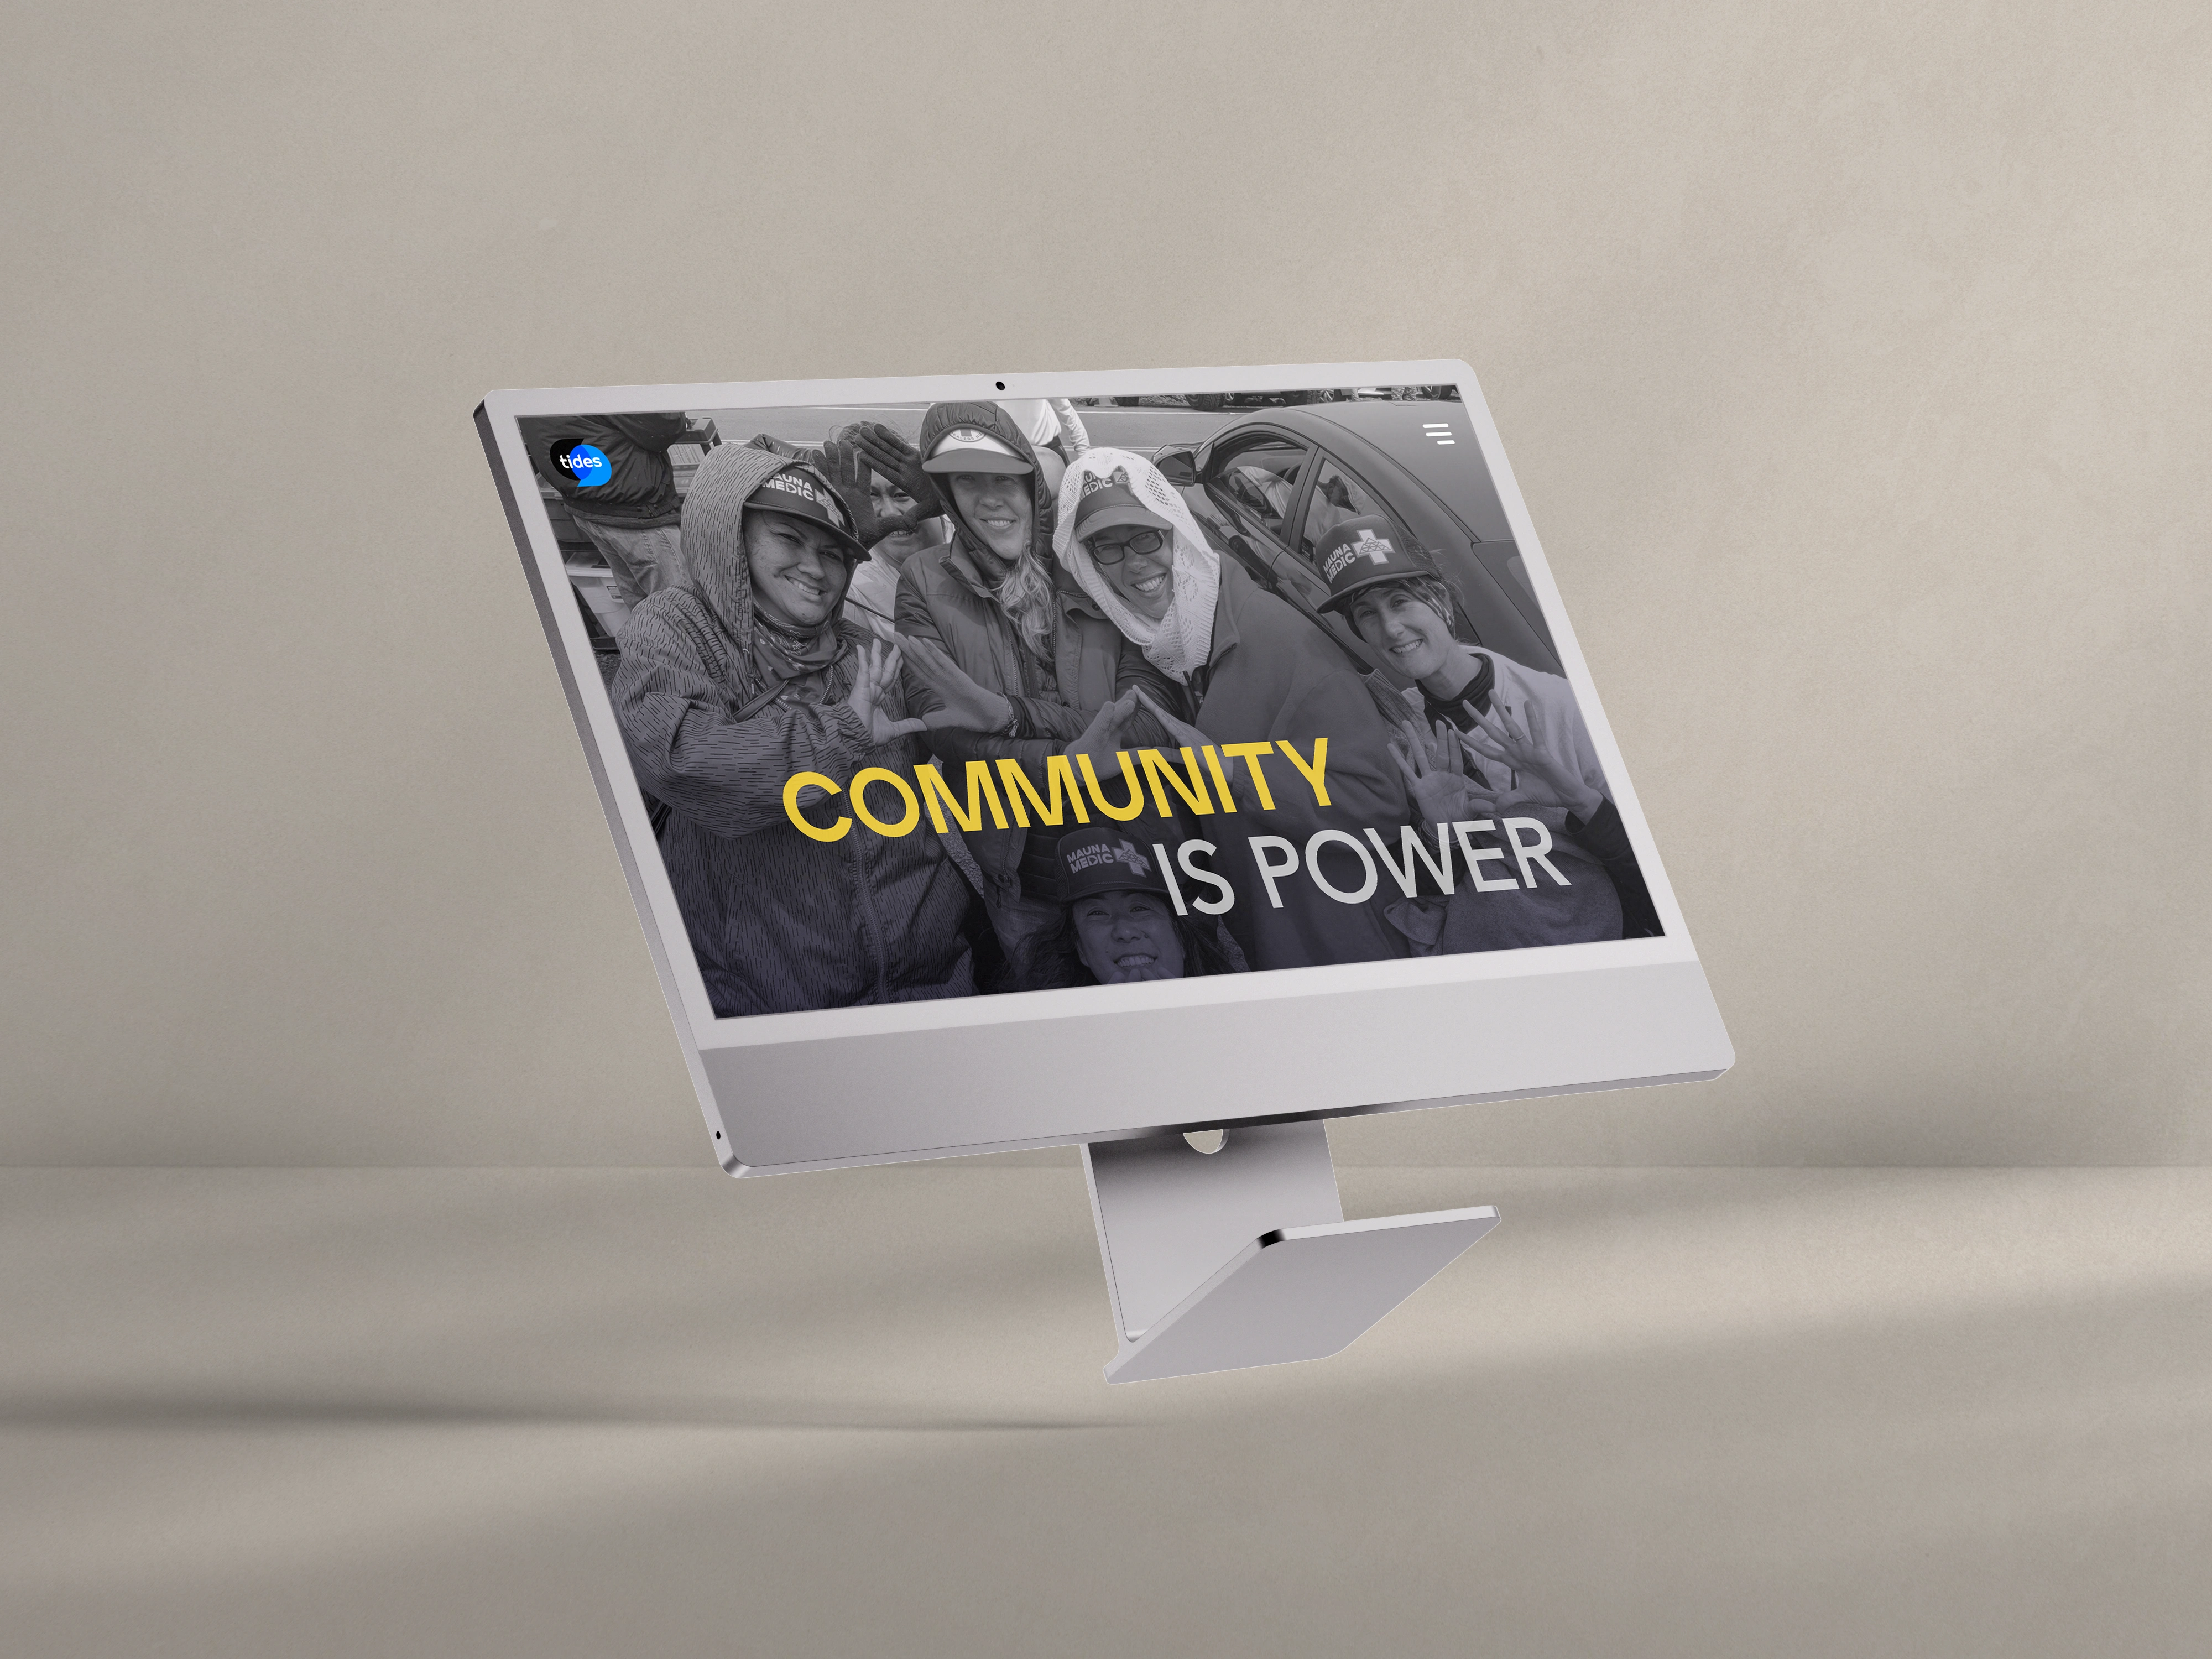
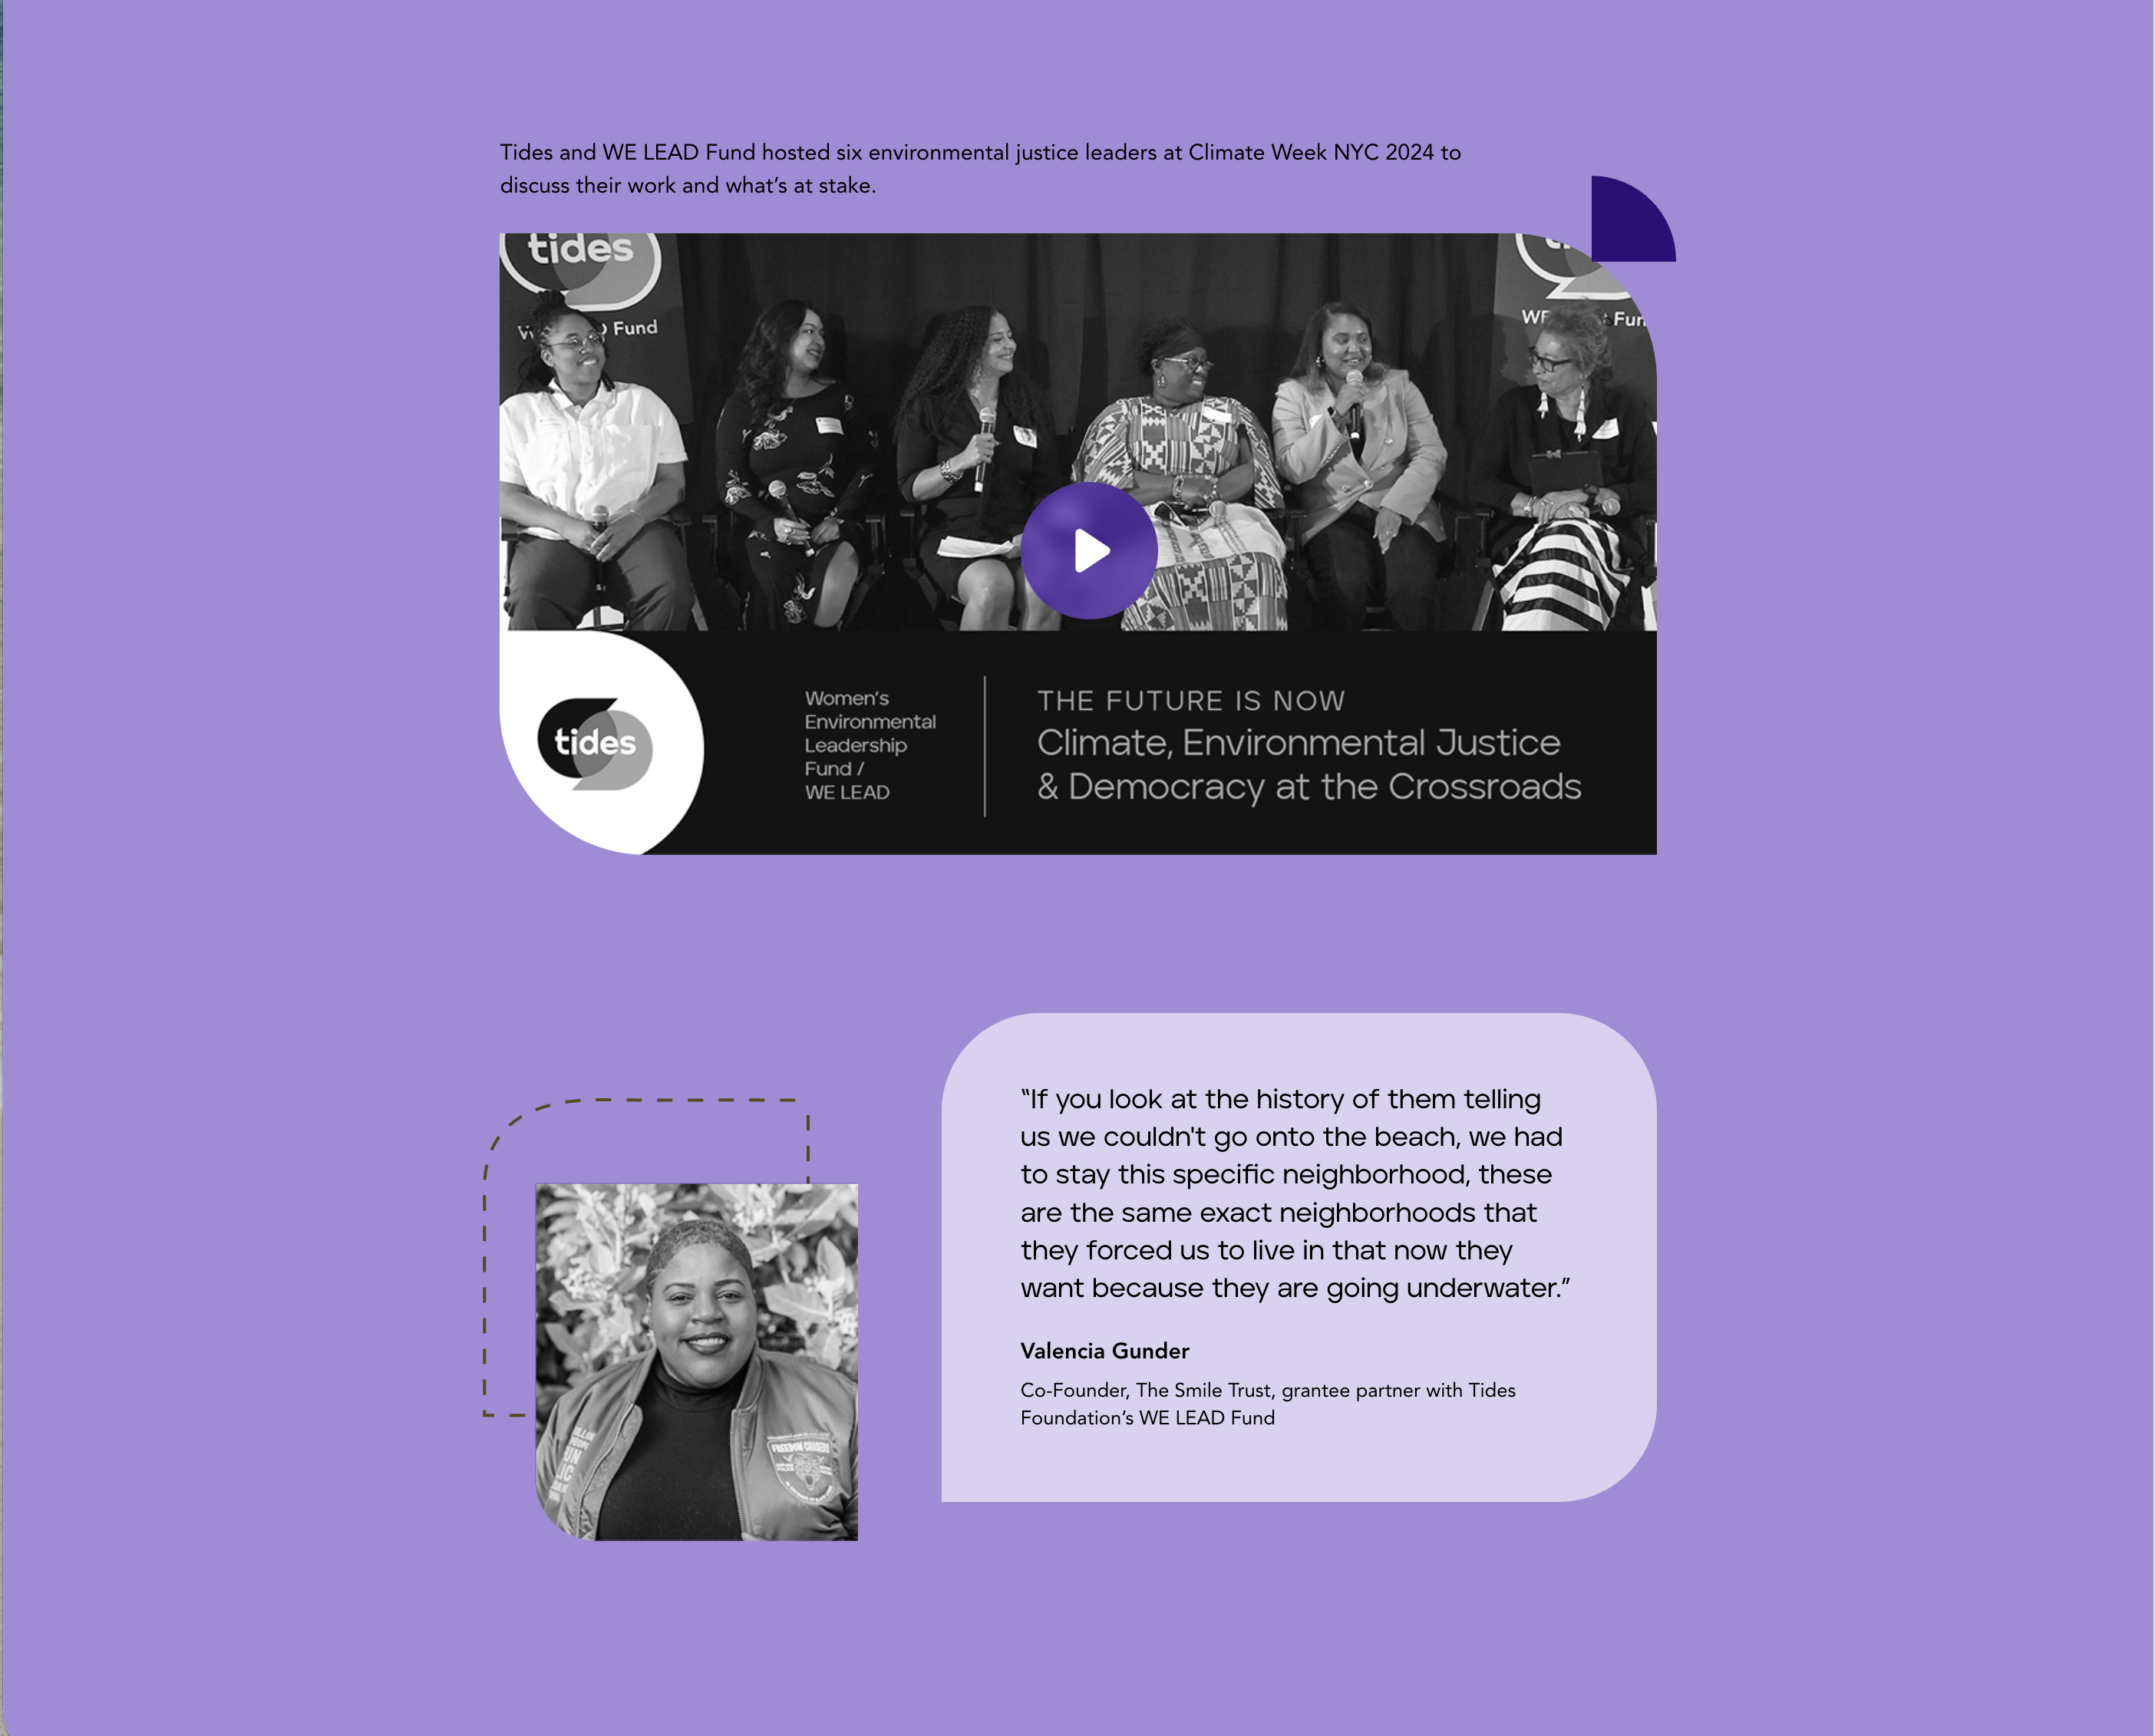
Senior Creative Manager, Tides
The designers at Acton Circle are extremely creative, easy to work with, professional, flexible and timely with deadlines, and achieve results that have earned us high praise and accolades for our materials.
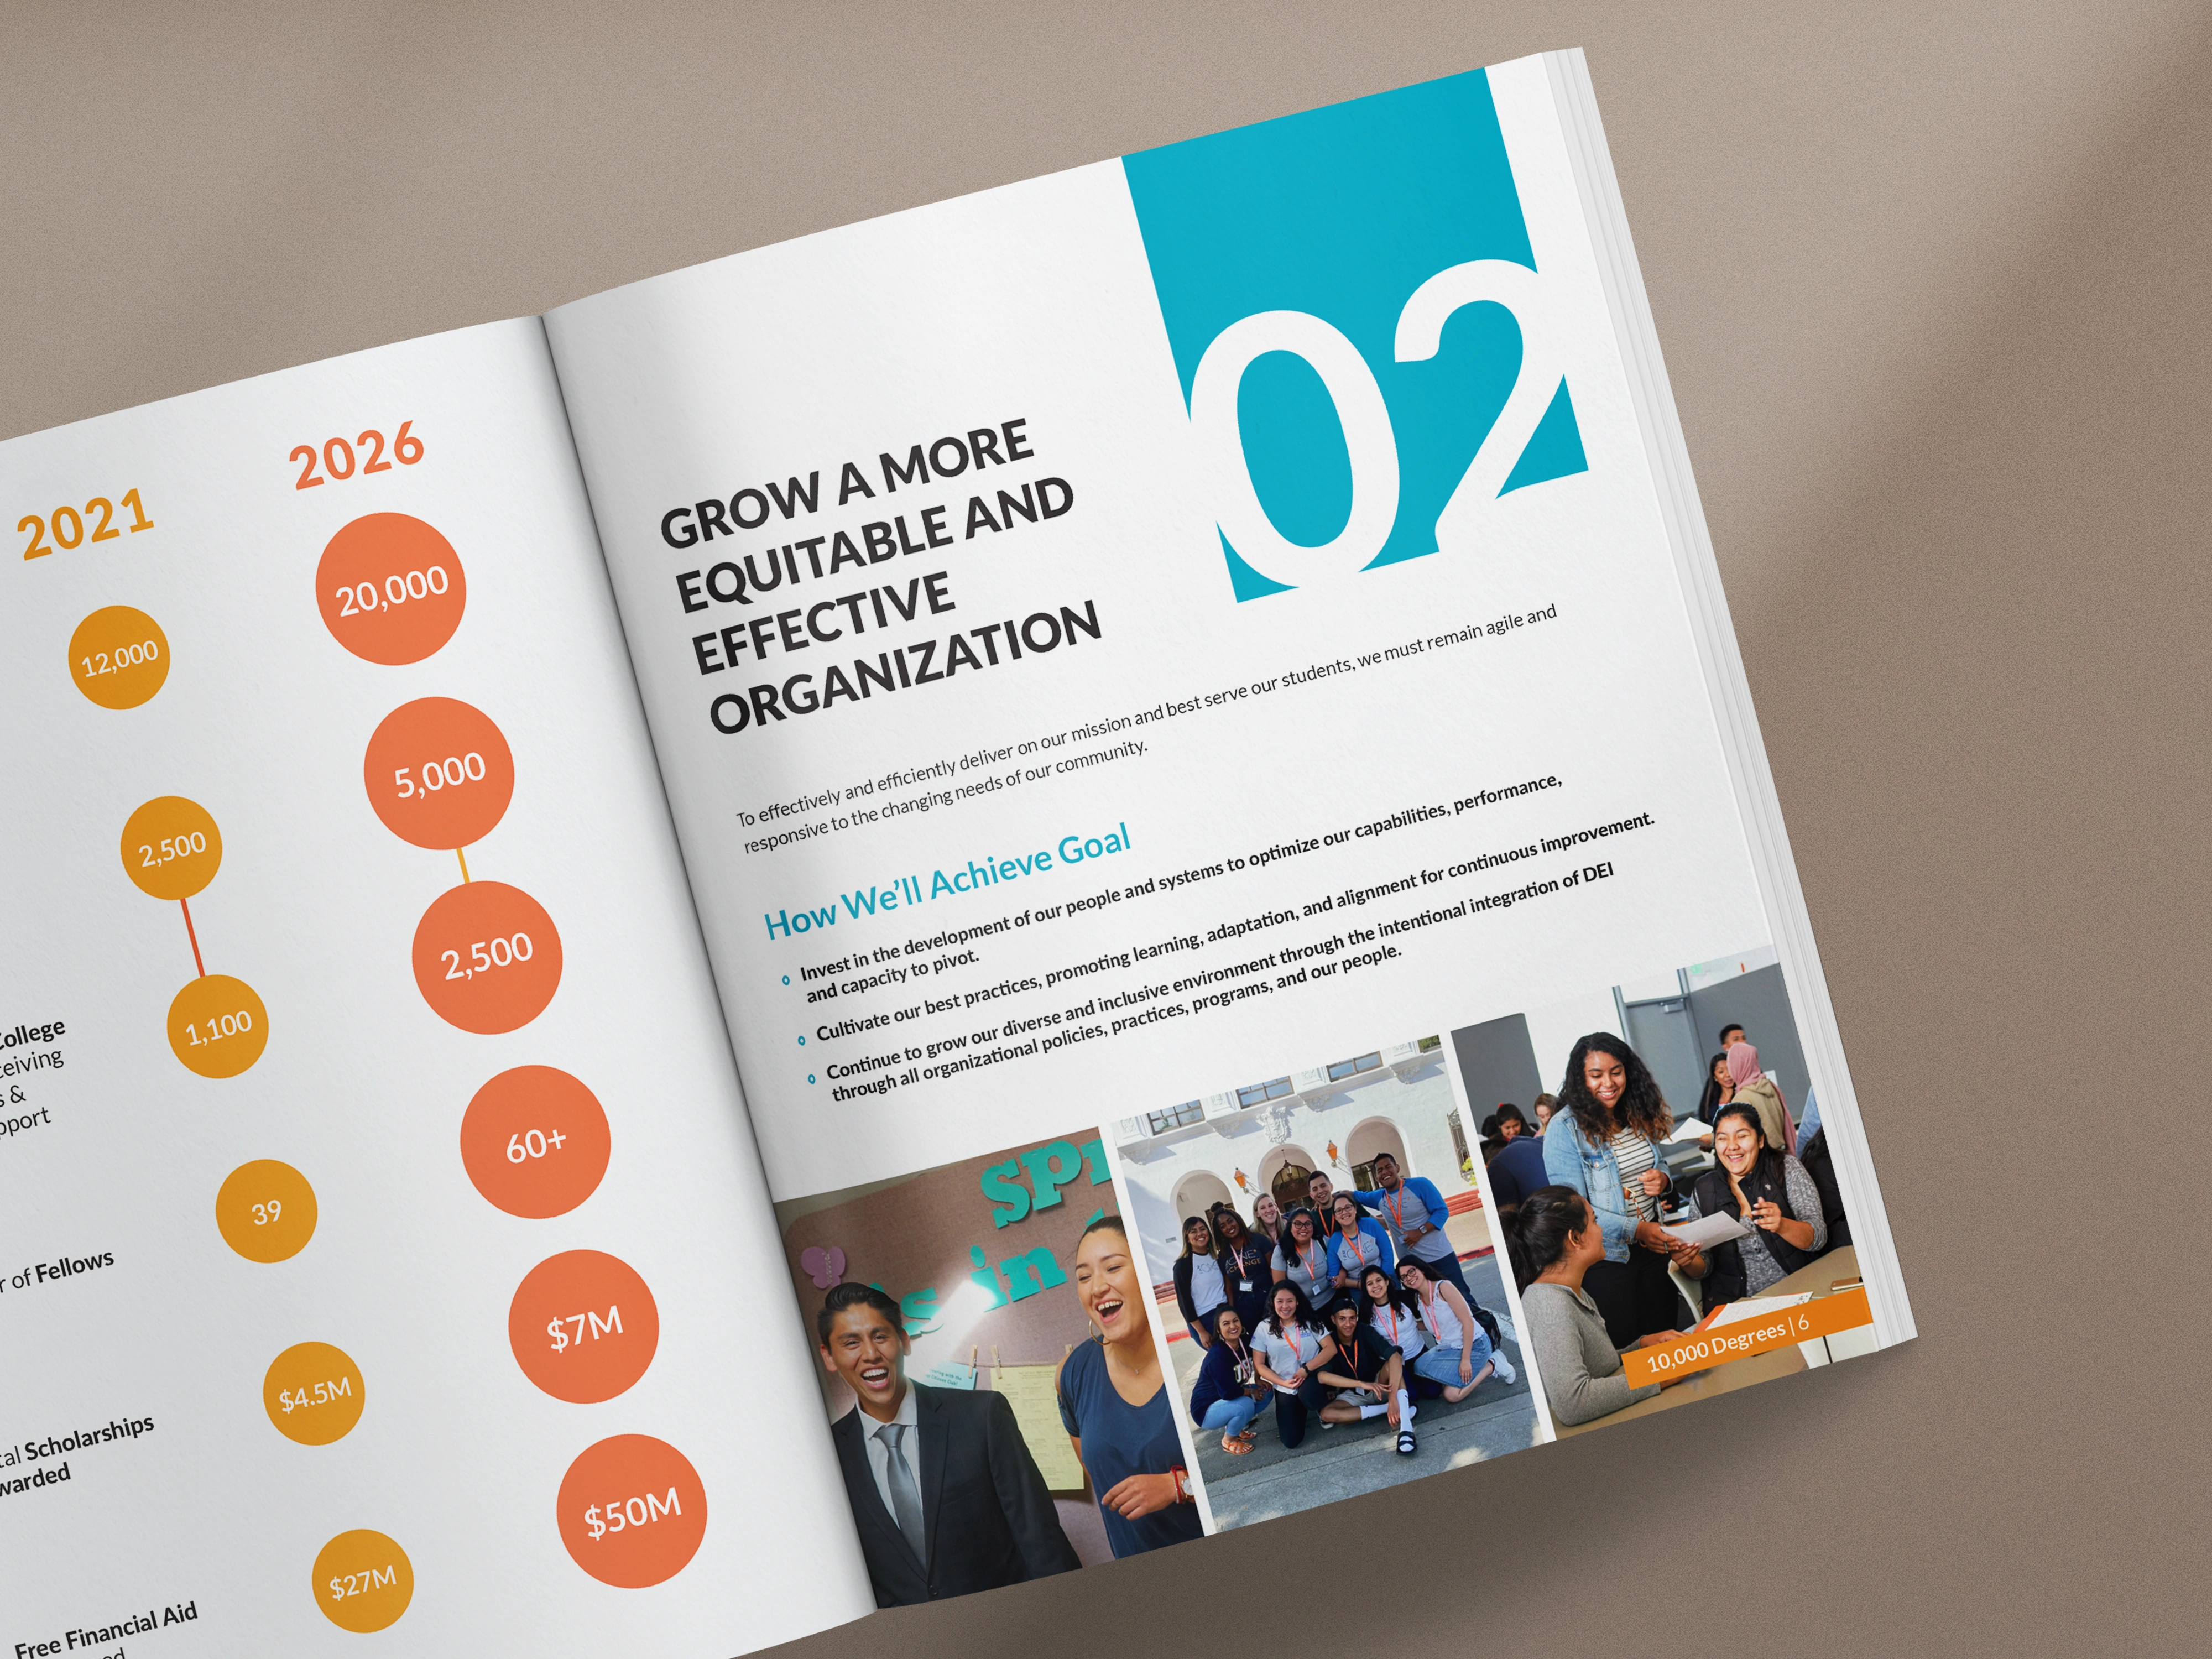
Alaina B.
Director of Marketing, 10,000 Degrees


.avif)
.webp)