Most teams approach the digital vs print annual report decision like it’s a preference question, like choosing between two equally valid options based on vibes or budget. But format is a strategy decision. It should follow your audience, your goals, and how you plan to use the report after it launches. Not the other way around.
I’ve designed annual reports in every format: print-first PDFs meant to sit on a board member’s desk, fully interactive microsites built for large foundation audiences, and hybrid approaches that serve both. What I’ve learned is that the “best” format is the one that meets your supporters where they are, and still gives your team something useful to work from all year.
This article walks through how to make the call.
→ Not sure where your report stands? Get the free Annual Report Checkpoint
What Is a Print Annual Report?
A print annual report is what most nonprofits picture when they hear “annual report”: a designed, static document (usually a PDF) that summarizes your year, your impact, your financials, and your supporters.
It can be distributed digitally as a downloadable file, printed in small batches for key stakeholders, or both. The format is fixed. What you design is what donors get.
When print works well:
- Your donor base skews older or prefers tangible materials
- You’re mailing reports to major donors or board members
- You need something easy to attach to a grant application
- Your team doesn’t have bandwidth for web development or ongoing microsite management
- You want design that’s fully controlled, no browser inconsistencies or rendering surprises
Print isn’t dying. It’s just becoming more intentional. The organizations still investing in beautifully designed print reports are usually doing it for a specific, high-touch audience, and it works because of that specificity.
What Is a Digital Annual Report?
A digital annual report takes your impact story online, usually as an interactive microsite, a scrollable landing page, or an enhanced flipbook. Instead of a static PDF, readers can click, scroll, watch, and explore at their own pace.
Common elements in digital annual reports:
- Video and audio that bring community stories to life
- Animated data visualizations that make complex numbers easier to absorb
- Clickable navigation that lets readers jump to what matters most to them
- Mobile-responsive layouts that work across every device
- Embedded forms, donation buttons, or social sharing
The Tides Foundation is a strong example of this done well. Their microsite-based annual report isn’t just designed to be read it’s designed to carry a movement forward. Every section is built for a specific audience, with the flexibility to go deep without overwhelming readers who just want the highlights. See how it came together in the Tides Foundation case study.
When digital works well:
- Your audience is younger or highly digitally active
- You have complex data that benefits from animation or interactivity
- You want analytics on what donors read and engage with
- You’re planning to drive traffic to the report through email or social campaigns
- Your team has the capacity (or a design partner) to manage the build and maintenance
Digital vs Print Annual Report: A Real Comparison
Here’s how the two formats stack up across the things that matter for nonprofit comms teams:
Engagement
Print: Familiar and easy to skim. A beautifully designed print report can sit on a major donor’s desk for months quietly doing engagement work long after it launched.
Digital: Designed for longer active engagement. Video, animation, and clickable sections keep readers exploring. You also get data on what they clicked.
Engagement isn’t just about time-on-page. A print report on a major donor’s desk for six months is doing serious relationship work. Just quietly.
Design control
Print: What you design is exactly what the reader sees. No browser inconsistencies, no font rendering surprises, no layout breaks on obscure screen sizes.
Digital: Requires more QA across devices and browsers. But done well, the flexibility to animate, link, and layer information is worth the extra lift.
Cost and production time
Print: Design timeline typically 2–4 weeks. Add printing and mailing costs if you’re doing physical distribution.
Digital: 6–8 weeks depending on interactivity. Higher upfront design and development cost, but no printing or postage. Easier to update after launch.
Repurposing and Year-Round Use
Print: Strong sections can be pulled into donor presentations, grant decks, and follow-up materials. With the right design system, your print report becomes a content library.
Digital: Easier to share, link to, and embed. Sections can live independently as landing pages. Analytics tell you which stories resonated which is useful data for your next campaign.
Both formats can treat your annual report as a content system, not a one-and-done document. The format affects how you repurpose, not whether you can.
.avif)
Get The Annual Report Checkpoint
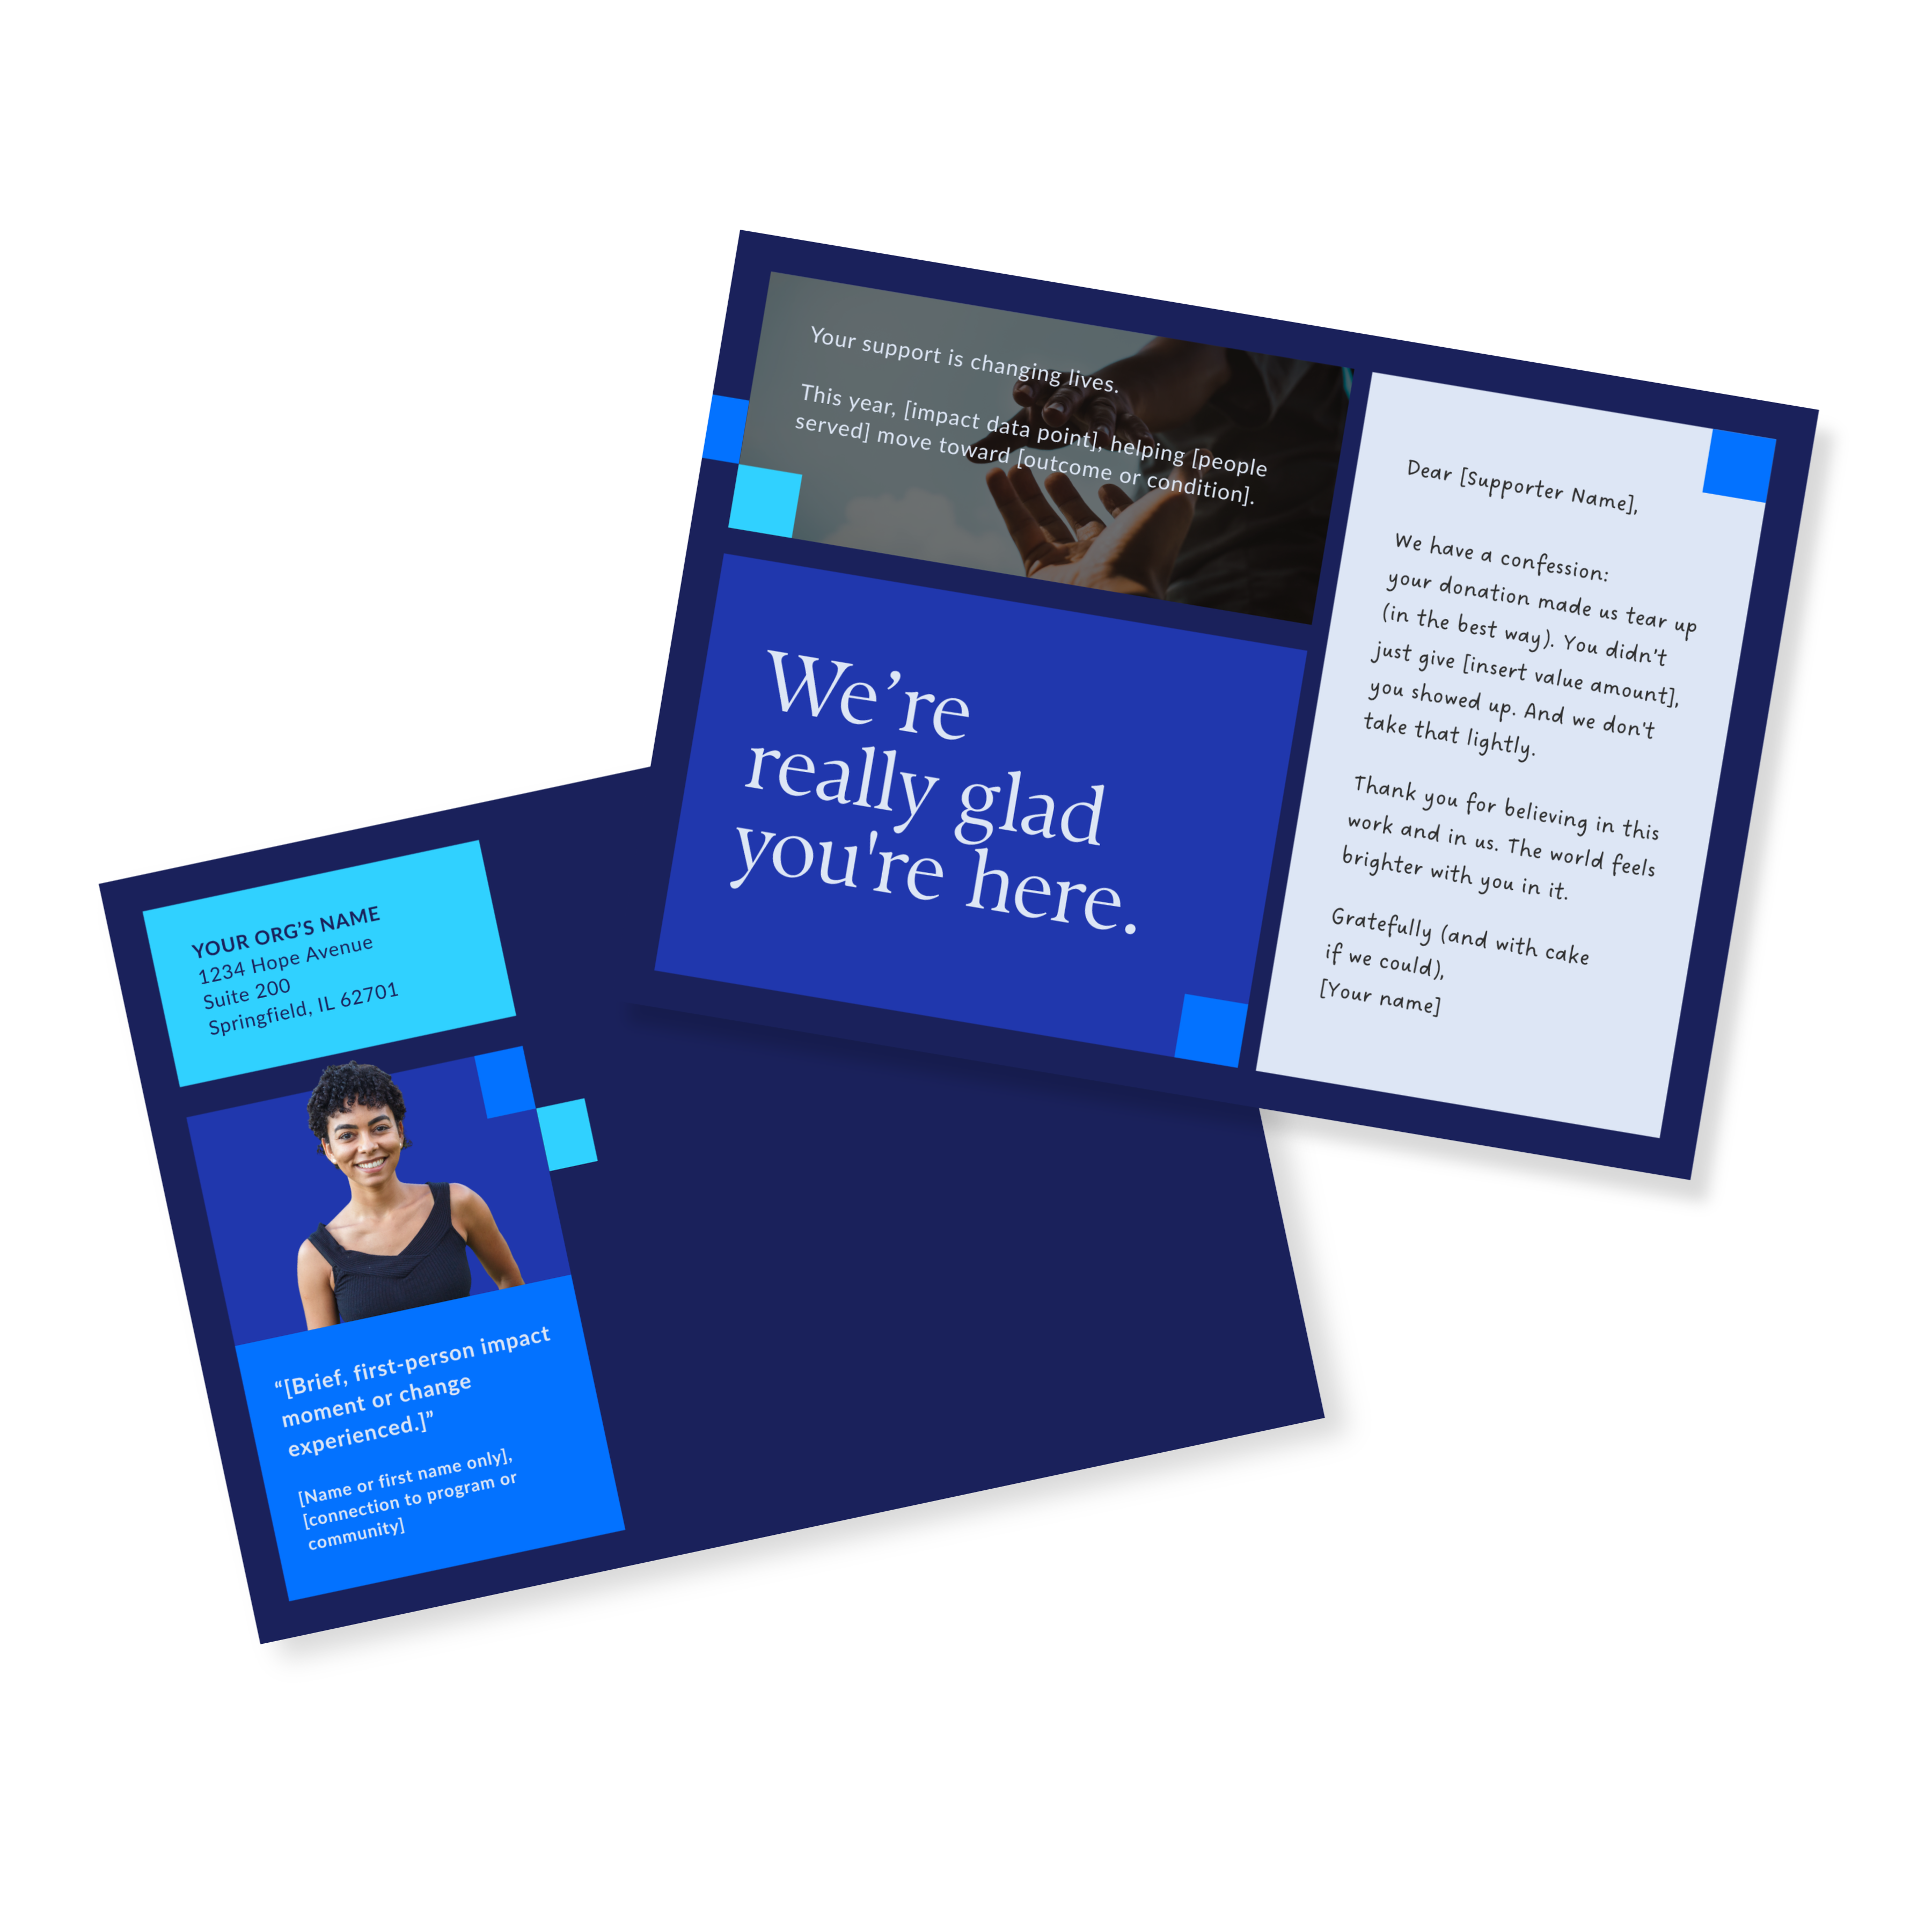
Donor Thank You Postcards Templates
Enter your info and we’ll send the postcards straight to your inbox:
The Hybrid Approach (What Most Nonprofits Do)
Here's the real answer to the digital vs print question: most nonprofits doing this well aren't choosing one or the other. They're doing both, strategically.
A well-designed PDF goes to major donors, board members, and grant-makers who want something they can hold, annotate, or attach. A digital version (even just a well-designed landing page with the key sections) serves the broader donor audience, gets shared on social, and drives traffic year-round.
10,000 Degrees does this particularly well. Their annual report is designed with digital-first layouts, but includes a clean downloadable PDF for donors and funders who prefer it. One report. Two formats. Both working. See how it came together in the 10,000 Degrees case study.
The hybrid approach isn't a compromise. It's the smartest use of one report's worth of content. You're not making two reports, you're meeting two audiences with the same story.
How to Decide Which Format Is Right for Your Organization
Here are the questions I walk through with organizations when this comes up:
1. Who is your primary donor audience?
If your major donors are 55+ and prefer mailed materials, a beautifully designed print PDF with a small physical print run might outperform any microsite. If you're building a younger donor base or running digital campaigns, a web-based report is going to do more work for you.
2. What does the report need to do after it launches?
Drive traffic and support an end-of-year campaign? Digital. Support in-person donor meetings and grant applications? Print. Both? Hybrid.
3. What can your team realistically maintain?
A microsite that breaks on mobile and never gets updated does more damage than a clean PDF. Be honest about your team's capacity before committing to interactive features that require ongoing maintenance (if there is any).
4. What's your budget for design AND distribution?
Print has lower design complexity but adds printing and mailing costs. Digital has higher upfront design and development costs but lower distribution costs. Factor both sides into your decision.
5. How do you plan to repurpose the content?
This is where our BELIEF by Design™ framework shapes the decision. A report built as a content system (with modular sections, reusable graphics, and clear hierarchy) can fuel a year of communications regardless of format. But format affects how easy that repurposing is.
Common Questions About Digital vs Print Annual Reports
What's the main difference between a digital and print annual report?
A digital report includes interactive elements like video, animation, and clickable navigation. A print report is a static PDF or printed booklet. Both can be beautifully designed and belief-building. The difference is in how readers experience and engage with the content.
Are digital annual reports more expensive to create?
Not always. Interactive microsites with custom development cost more than a well-designed PDF. But a digital-first PDF designed for web sharing might cost about the same as a print-only design. The bigger cost difference is usually in distribution: print adds printing and postage, digital doesn't.
Can I have a PDF version if I go digital?
Yes, and most organizations should. A clean PDF download option makes your digital report accessible to donors and funders who prefer it, and makes it easy to attach to grant applications. This is the hybrid approach, and it's the one we recommend most often.
Which format do donors prefer?
It depends entirely on your donor base. When in doubt, ask your top 10 donors how they prefer to receive information. The answer will tell you more than any generalization.
How long does each format take to produce?
Print typically takes 2–4 weeks in design. Interactive digital can take 6–8 weeks depending on features. A hybrid PDF plus digital landing page falls in between, plan for 4–6 weeks minimum.
Format Is a Strategy Decision. Content Is Still the Foundation.
The format conversation is worth having, but it's the second conversation, not the first.
Before you decide between digital and print, you need clarity on what your report is trying to say, who it's for, and what you want supporters to feel when they're done. Format serves content. Not the other way around.
The Annual Report Checkpoint is a free self-assessment that helps you get that clarity before you invest time and budget in production. Five key areas across messaging, format, design, donor strategy, so you go into the print vs. digital decision with a strong foundation underneath.