A lot of nonprofit teams I speak to treat their annual report like a homework assignment. There’s just this feeling of dread. (Maybe you can relate.)
You’re pulling together content, nudging folks for final impact numbers, collecting photos, and trying to find the highest-res versions. If you’re lucky, you have a designer or someone on staff who can pull it all together. Worst case, you’re doing it all yourself.
There are a lot of moving parts. I get it.
But here’s what not many orgs realize: donors are deciding whether to keep believing in your mission as soon as they open your annual report. So, yes, it is a big deal.
Today, I’m walking you through four adjustments you can do to make your report more compelling and help donors see why they should stay involved in what you’re doing.
Stop Creating Annual Reports as Documents and Start Creating Experiences
A report informs; an experience builds belief. And belief is what funds the year ahead.
When your report is just a document, donors might be informed or updated on what you’re doing, but they won’t feel anything. Your whole year of impact gets reduced to a PDF that no one reads all the way through.
An experience, on the other hand, starts before someone even opens your annual report. Maybe it’s the envelope the report comes in or the subject line introducing it. Whatever it is, that first moment of curiosity is where it all begins.
Then it moves into the report. Your supporters have opened the PDF or taken the pages out of the envelope. They’re seeing the cover. And they’re going to feel things before they even read a word.
Feeling floods in before fact. Through texture, through color, or through that first image they see.
Think about the organizations your donors admire. Nobody’s quoting their impact data verbatim at a dinner party, but they do remember how the report felt in their hands or how a story pulled them in.
That’s not a happy accident; that’s what happens when design is intentional every step of the way.
Adjustment 1: Build a Journey, Not Just Independent Sections
I’ve seen a lot of reports that just list headers like “Programs,” “Impact,” and “Financials.” And that’s fine, but it doesn’t help you stand out.
Instead, think of your story in scenes. Start with the tension or the problem. Show the turning point. Then, reveal the transformation and the ripple effect. Beyond just listing departments, you’ve organized the story according to the human journey.
When donors start to feel that progression building, they’re more likely to stay engaged to see what happens next.
Let’s say you work with low-income students who you help get to college and thrive beyond it. In this case, the story’s about a girl named Maya. She’s sixteen, juggling jobs to help her mom pay rent, and falling behind in class. Her teachers and counselors take notice, but they don’t really see the deeper issue.
But then, she gets connected with your after-school program and receives hot meals, a safe place, and a counselor who supports her beyond just academically. Six months later, Maya starts to see the shift in her grades and tells her counselor that she wants to study nursing.
She’s been talking about your program so much at home that her brother ends up joining, too. And her mom attends a workshop you put on for parents. Then, Maya gets to tell her story as the first person in her family to apply to college at your donor breakfast. This story makes a real impact on the people in the room.
That is how powerful your work becomes when you position it story-first instead of burying it under mechanical program titles and lengthy descriptions.
.avif)
Get The Annual Report Checkpoint
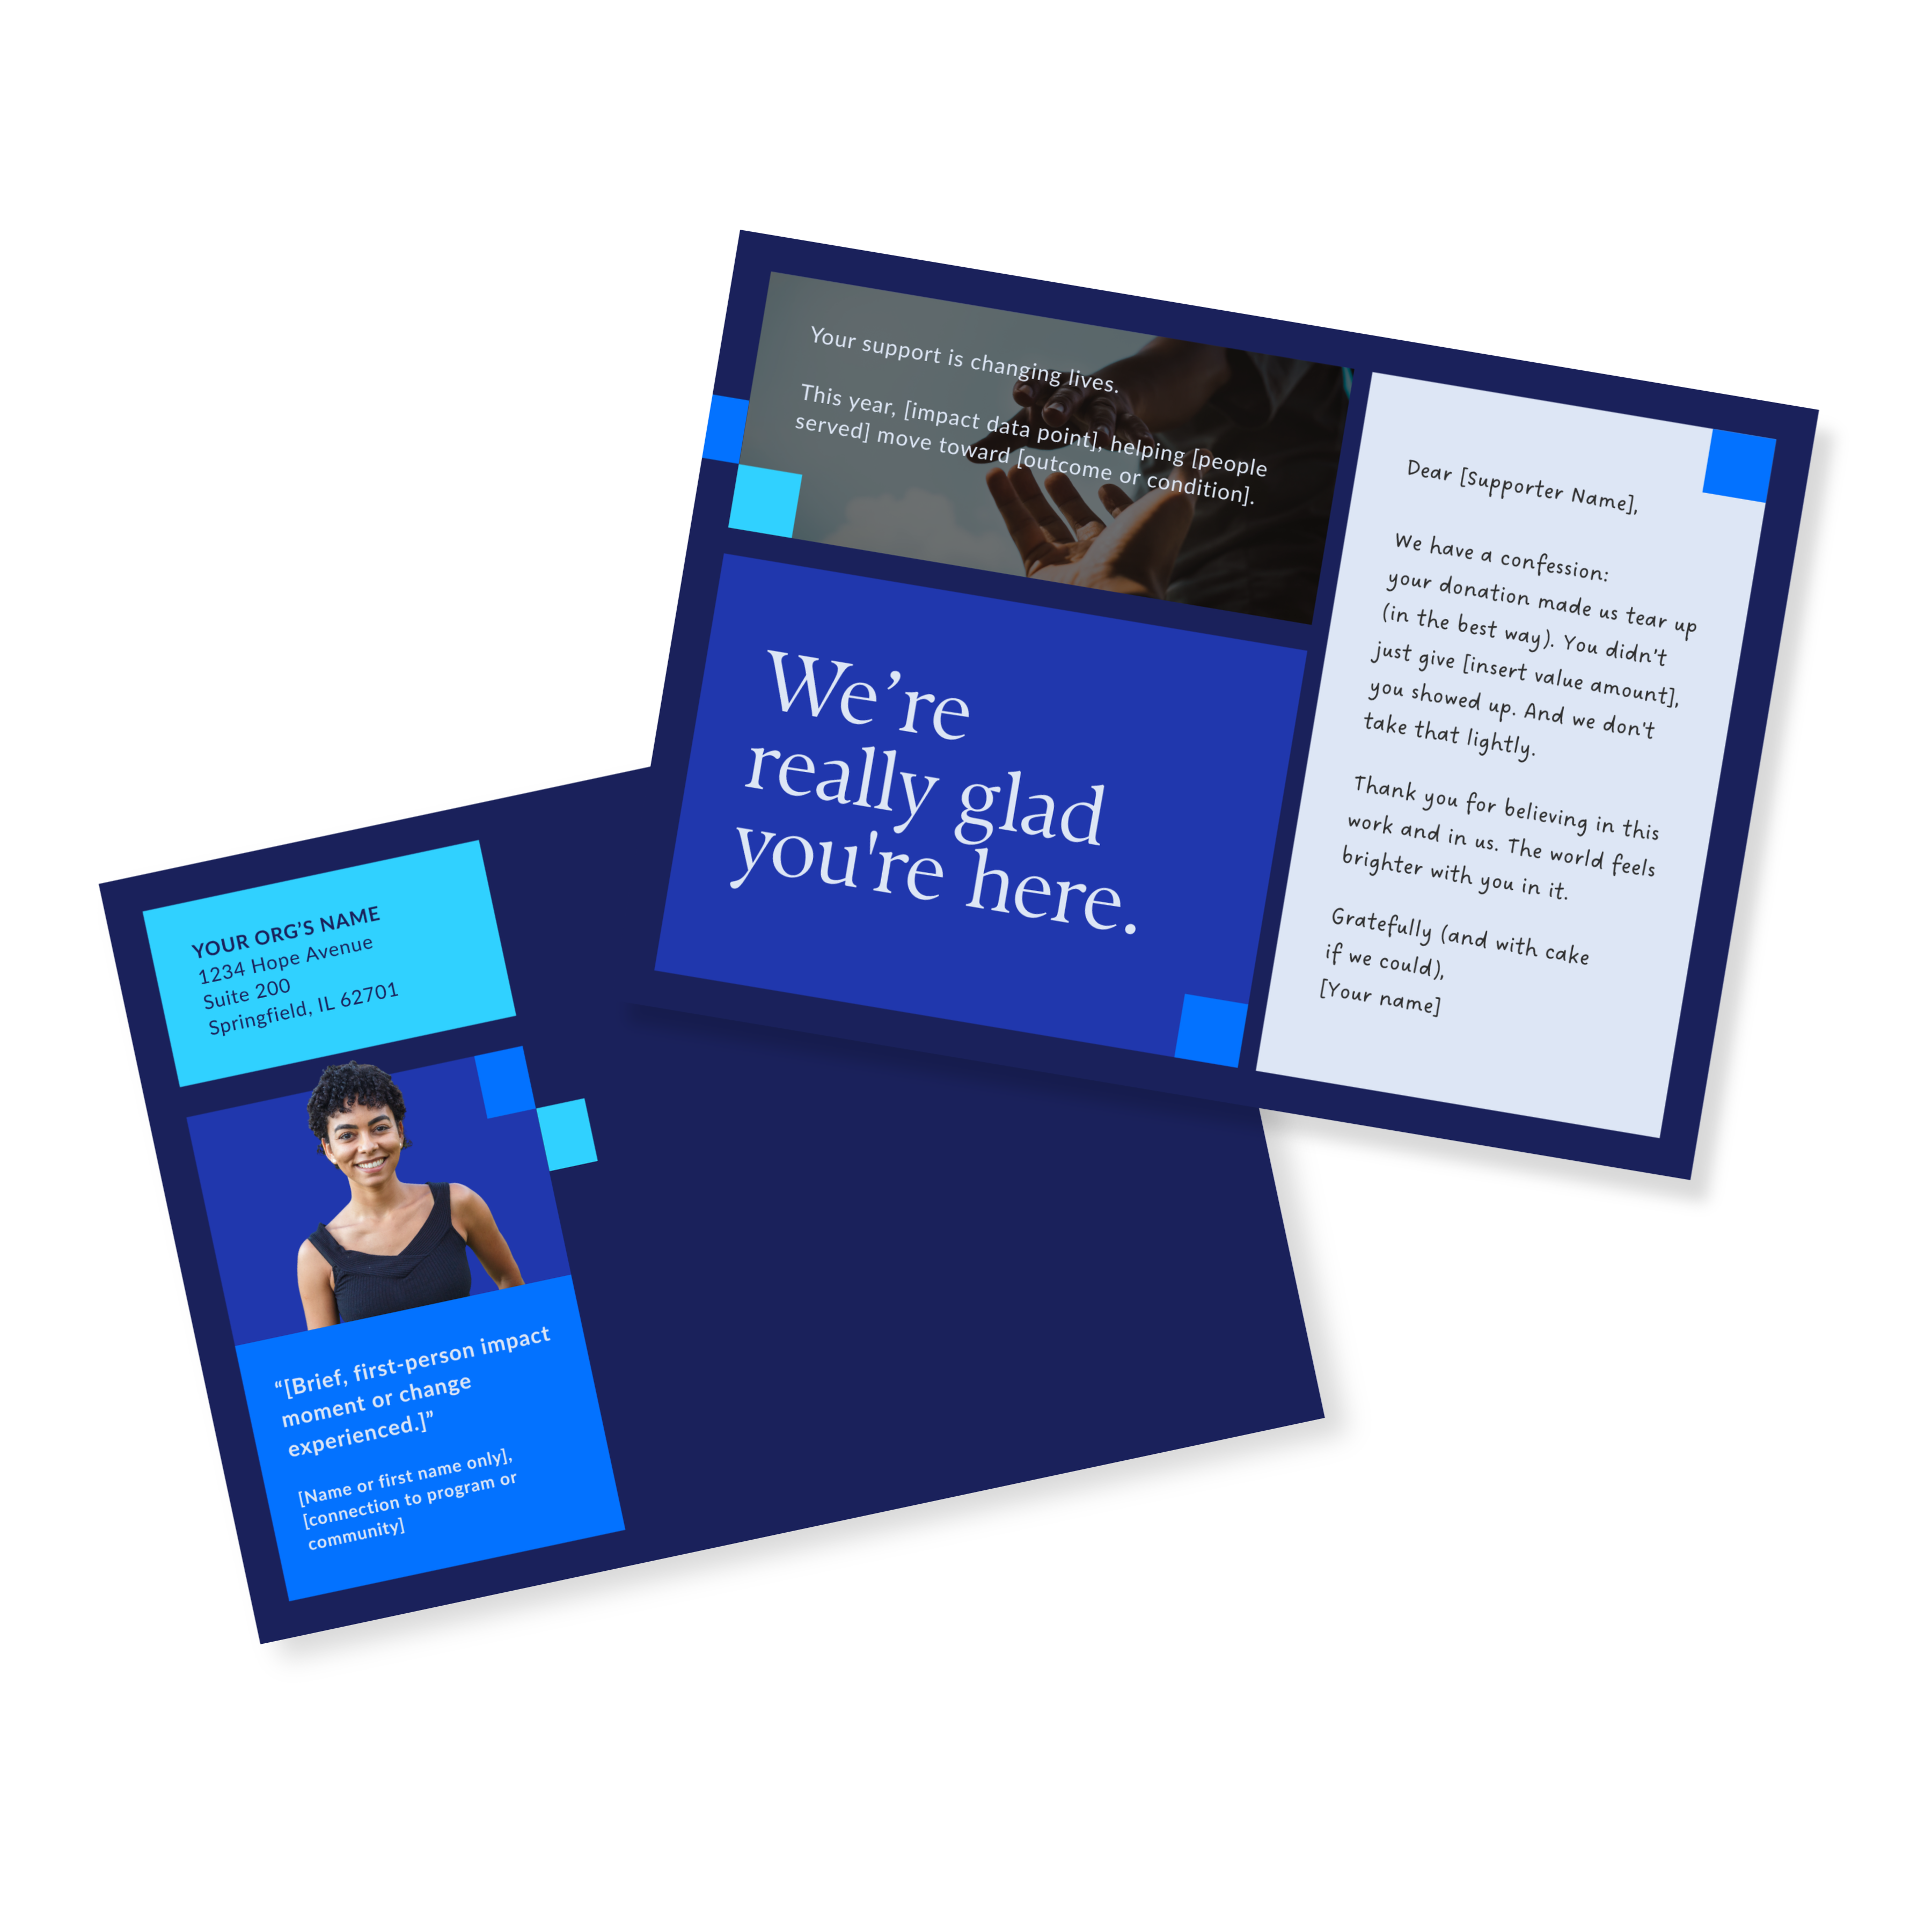
Donor Thank You Postcards Templates
Enter your info and we’ll send the postcards straight to your inbox:
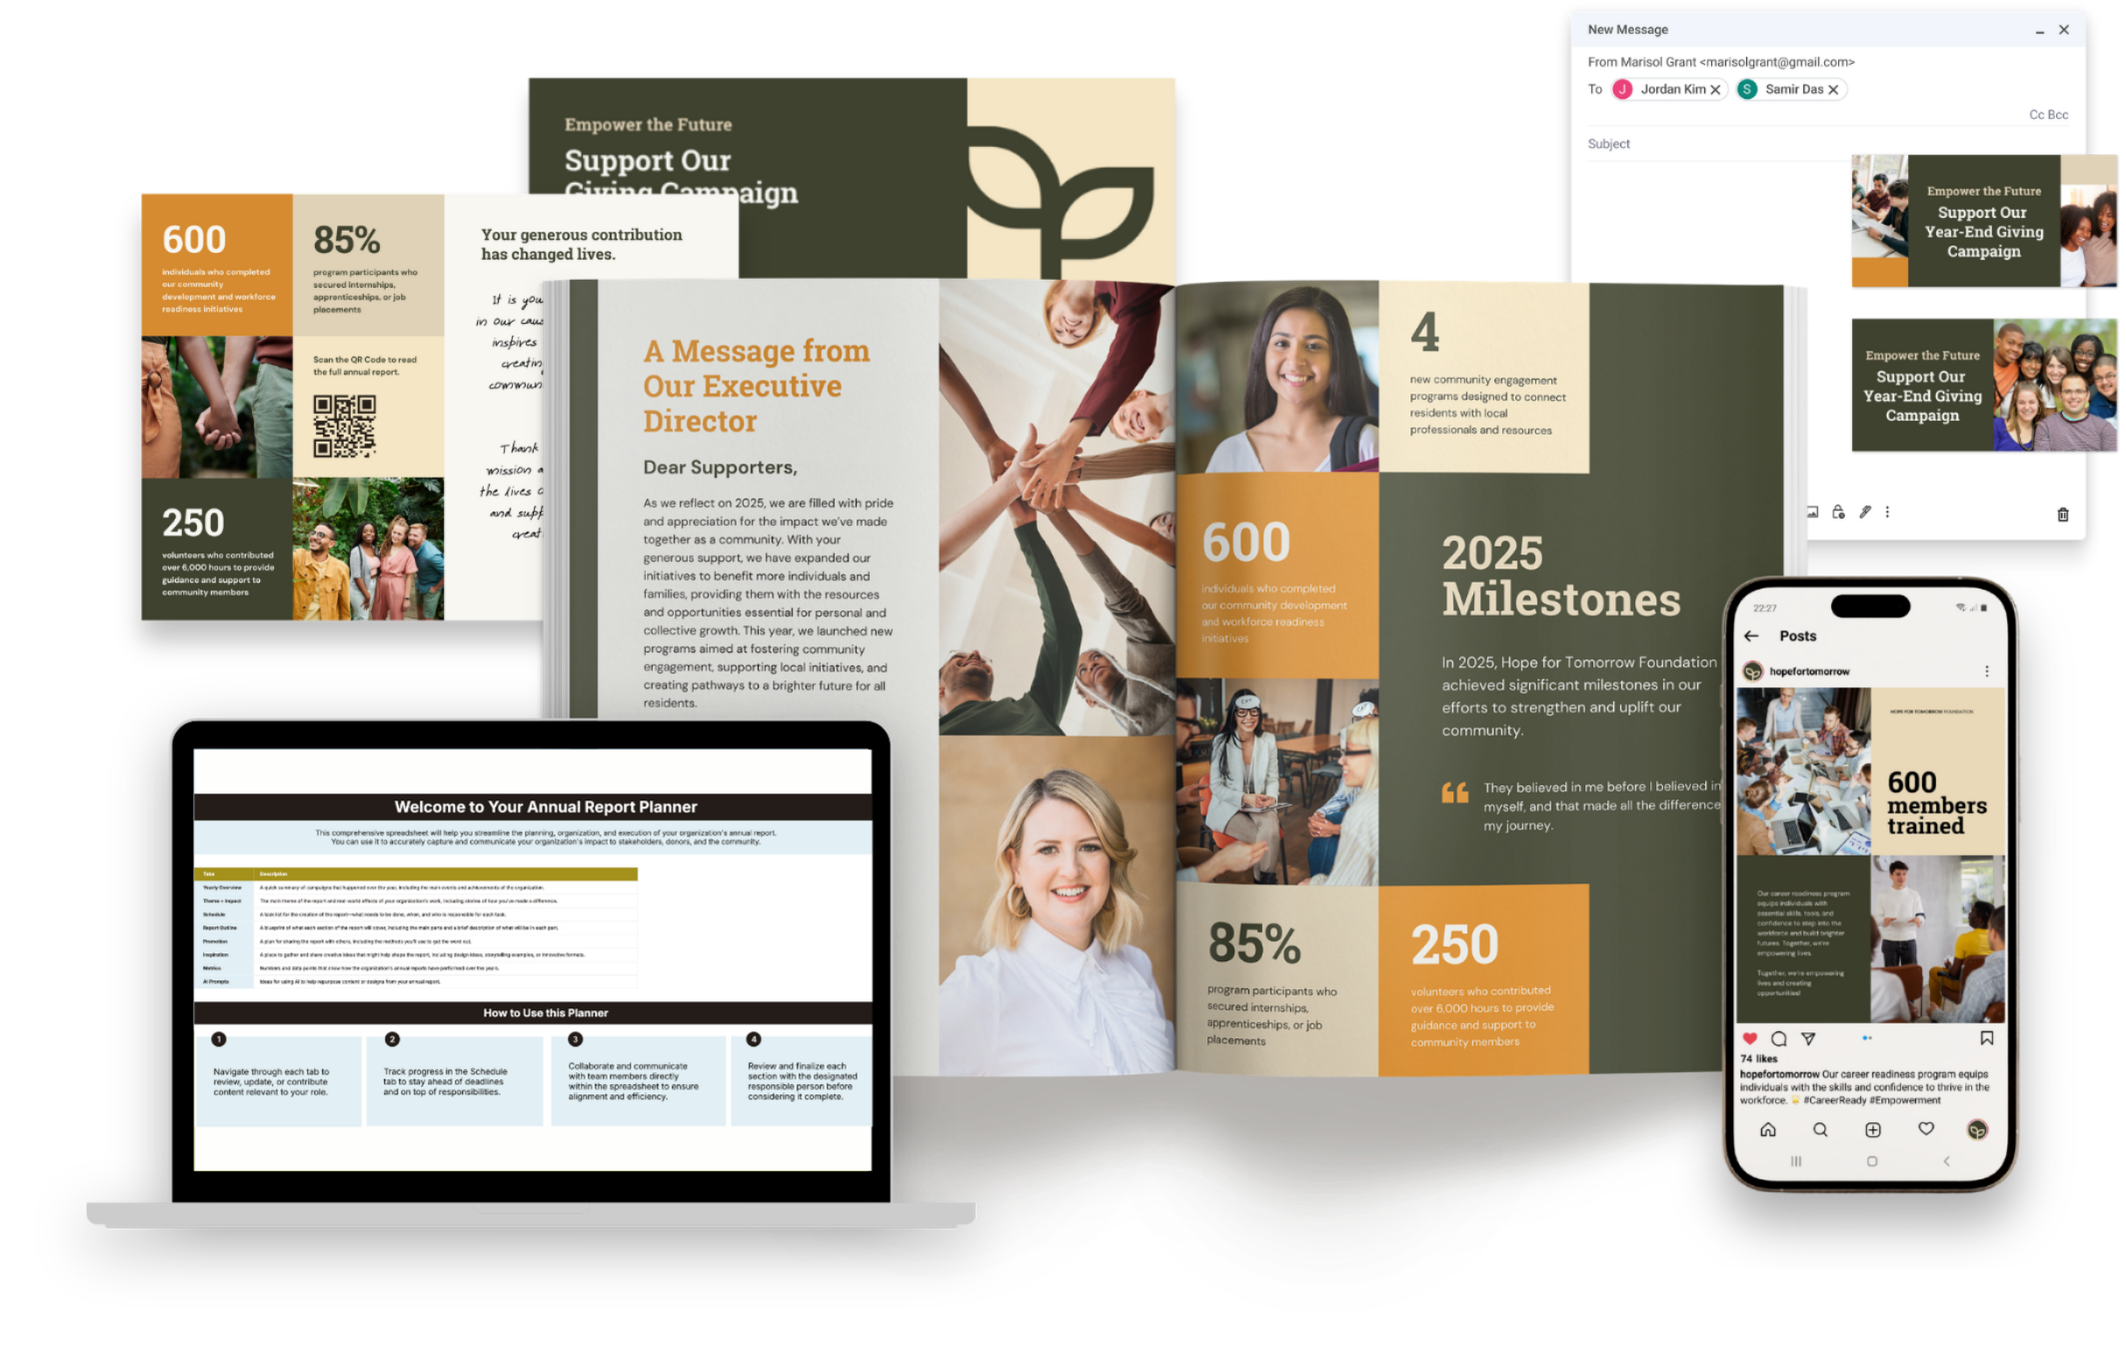
The Annual Report System
Turn a folder of half-finished docs into a donor-ready annual report, without hiring a designer or pulling another all-nighter.
Adjustment 2: Let the Donor Walk Through Your Story
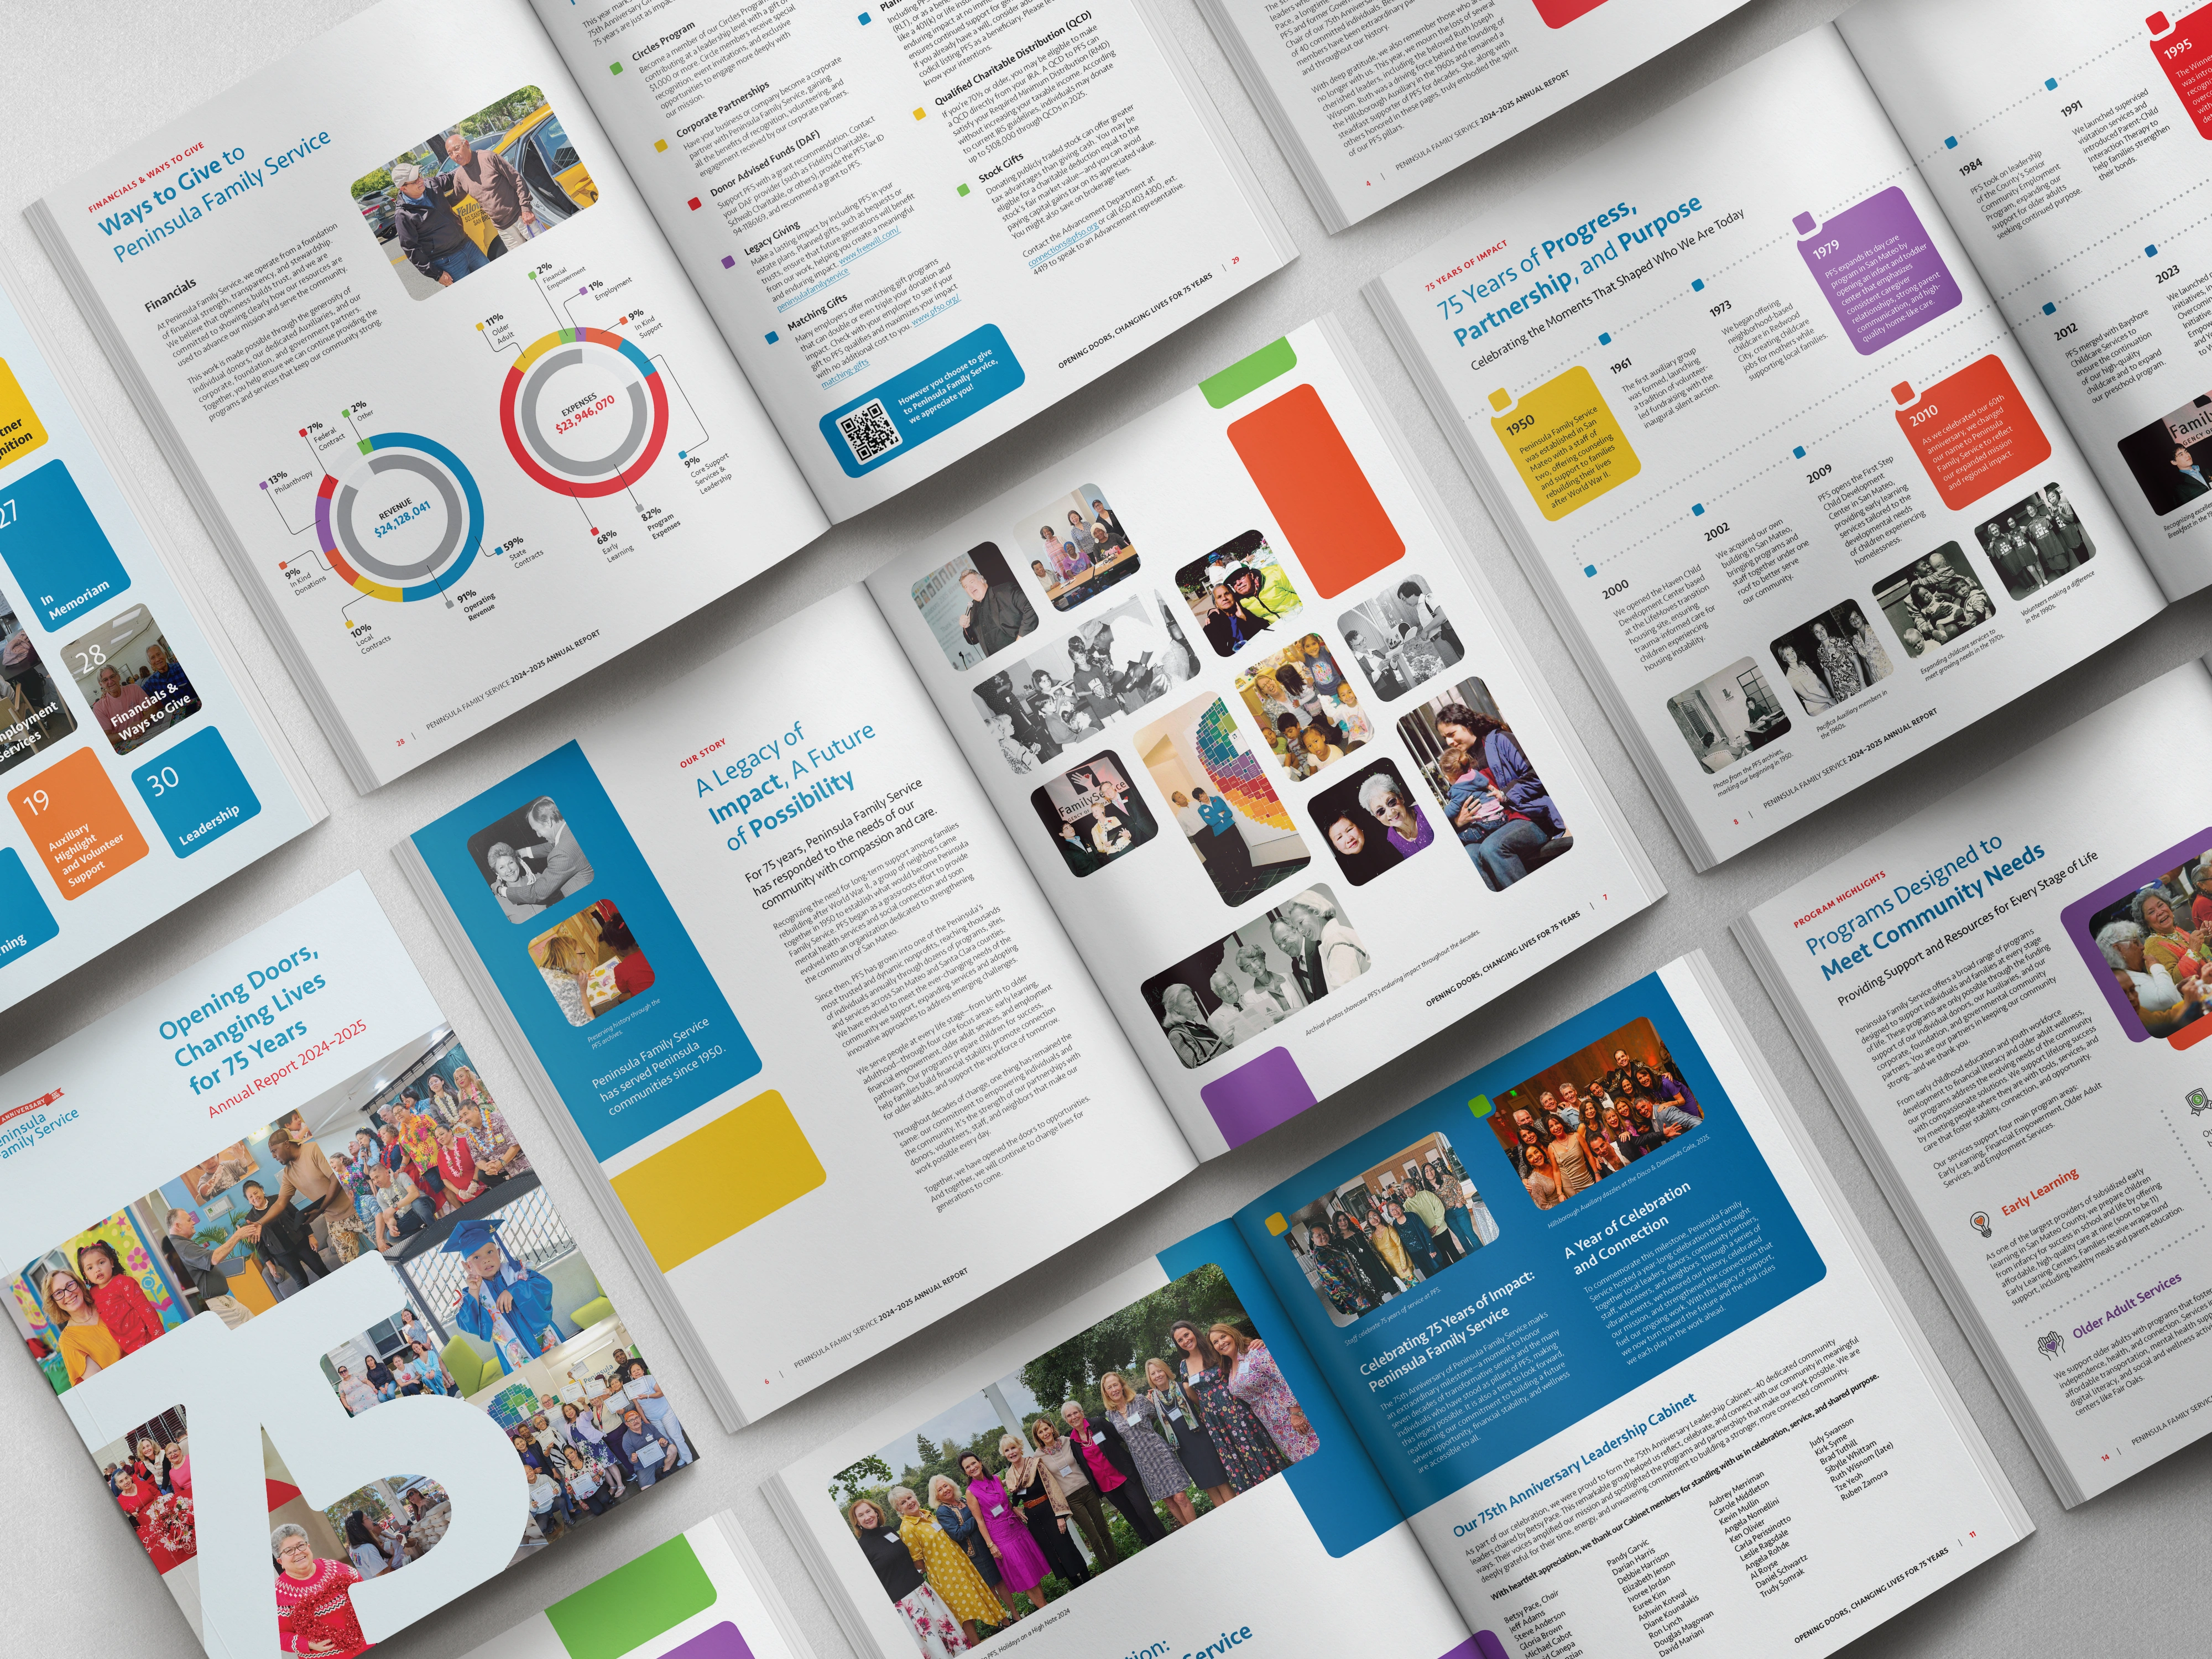
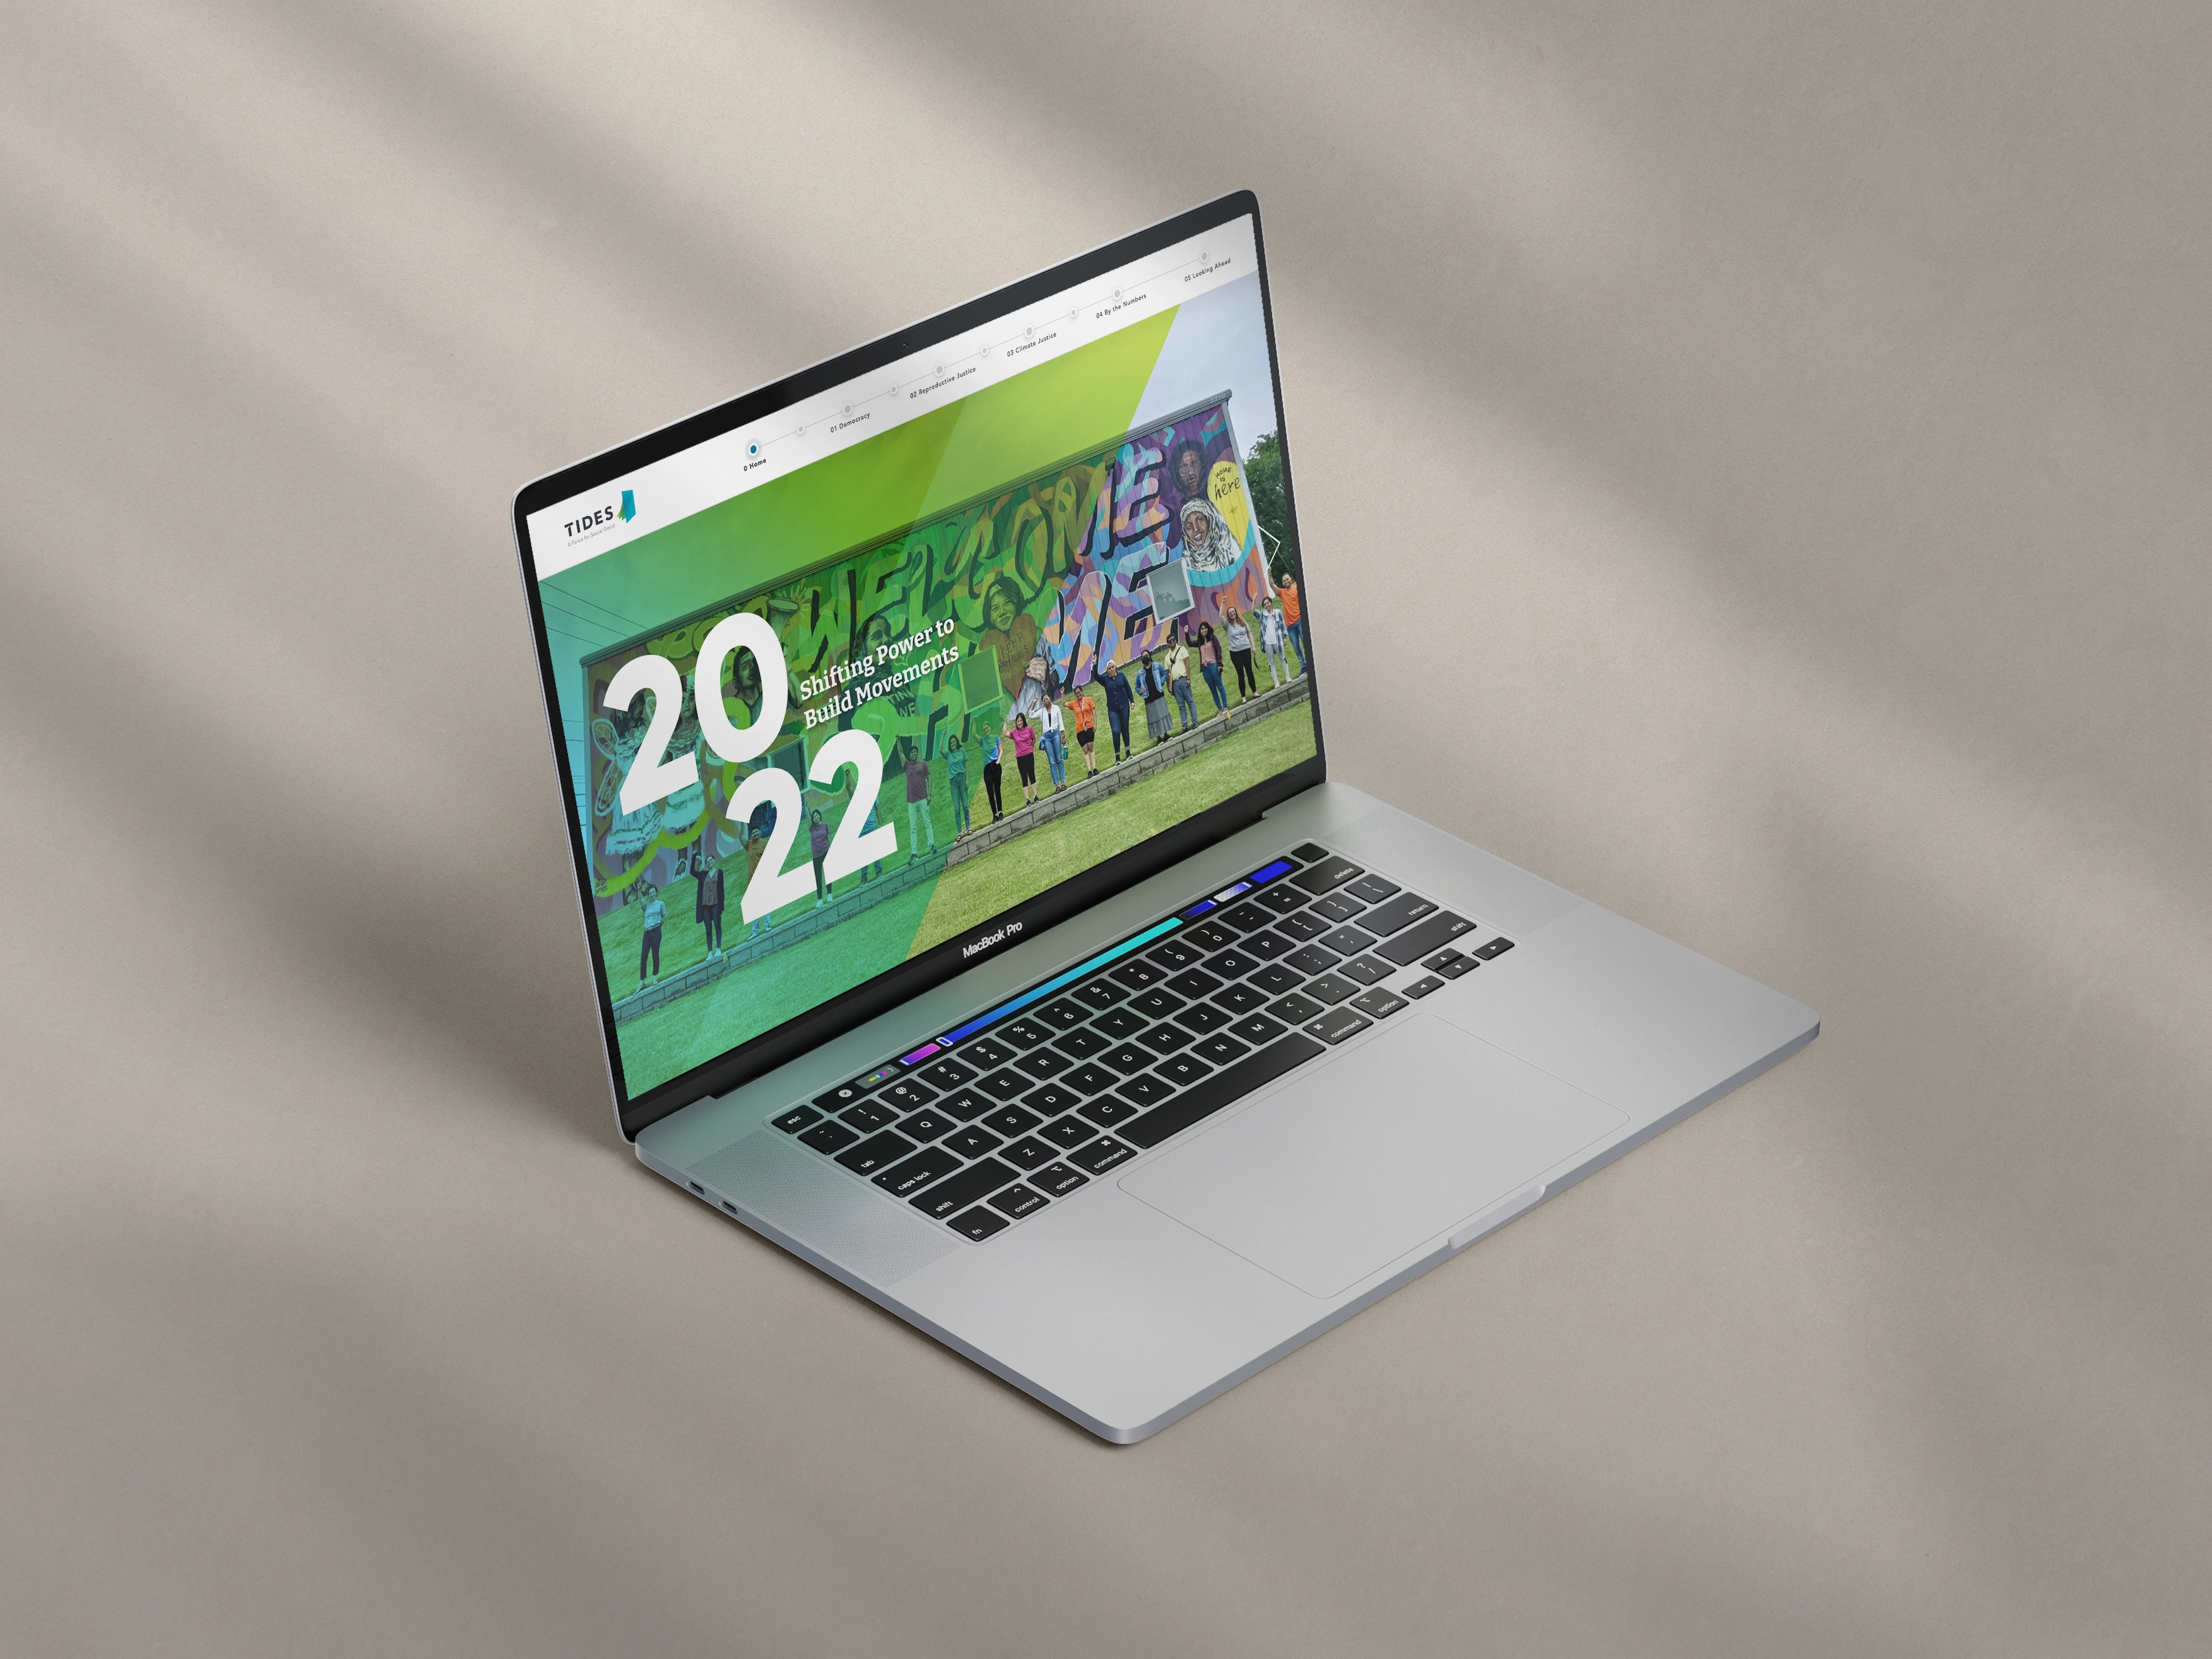
Instead of presenting a static PDF like a museum wall that people can’t really engage or interact with, think of your report as an immersive path.
If you have a landing page version of your report, you can have quotes appear as someone scrolls down the page, have data animate as the impact unfolds, or leave room for images. All these elements can make a stronger impression and give readers a moment to reflect.
In a printed report, this could look like pull quotes and stats woven through the spreads, large images with text on top that support your story, or book-like chapters dividing your report into more digestible pieces.
What you’re doing here is making donors walk through your impact page by page. The design mirrors the emotional arc of the story as it builds. That’s what increases engagement and keeps people reading.
Adjustment 3: Create Connection Through Specificity
“Families were supported” is a vague statement that anyone can claim. To stand out in a sea of other nonprofits doing similar work, you need to think about how you can add your unique point of view.
Give more specifics and really zoom in on the people you’re serving. Layer context in the way people process information.
For example, if you have an image of a family you’ve supported, consider adding an audio clip of that family sharing their story in their own words. When someone listens, they see not only the statements you’re making but also the lived experiences of people whose lives were changed. Then, you can support those elements with some stats that explain how many other families have been helped.
This way, you’re connecting layers of your impact through visuals, story, and data. And when those three things lock into place, that’s when belief really builds. Donors can see how the different parts of the story fit together.
Adjustment 4: Design with Emotional Rhythm in Mind
Think about how music tells a story and makes you feel something. Just like music, your report needs the highs and the lows.
Instead of giving every page the same amount of content, you can alternate between text-heavy pages and lighter ones. Maybe you have a really bold spread followed by a more relaxed, quieter one. Maybe you’re zooming in on a story and zooming back out to back it up with proof.
This emotional rhythm keeps donors on their toes and gets them excited about what comes next, even if they don’t know exactly what that is yet.
Taken together, these four adjustments will help shift your report from one that just informs (and is skimmed) to one that builds belief (and is read all the way through).
Check out the Annual Report System for nonprofit-specific layouts that lead with story-building depth, not decoration.