You printed your annual report layout, felt proud, and sent it to your entire list with a note that said, “We’re so excited to share our impact this year!” But then nothing happened. No one said, “Wow, this is beautiful. I’m so excited to support,” and no one shared it with their well-connected relatives. It just sat on your website as a PDF that no one asked for.
I get it. You did so much work. You most definitely deserve a little (read: a lot of) noise, not silence.
After working with over 60 (and counting) nonprofit teams on these projects, I can say the content is rarely the problem. The real issue is the layout... and always a lack of time.
Donors form an opinion about your report BEFORE reading a word. What they see first, where their eyes go next, and what they skip shapes their feelings, whether you planned it or not.
So keep reading to learn how to make your annual report’s layout work for you, not against you.
The Board Test (Steal This)
Here’s a little trick that will make a big difference in knowing without a doubt how your report is received. Hand it to someone who hasn’t seen it (typically, by default, you’ll probably have a leader or staff member who will be reviewing), then ask three questions:
- Does this look like our org right now?
- Where did your attention go first?
- What’s the one thing you’d remember if you closed it right now?
And if the answer to that last one is basically ”Uh... that you did a bunch of stuff?” then you likely have a layout problem. A good layout makes all three answers obvious, no explanation needed, and reinforces your key messages page after page.
Each spread should guide your readers exactly where you want them, in the order you want, and they shouldn’t even realize it’s happening. That’s the true power of design.
Now, let’s dive into the actionable tips that can help take your report to the next level.
1. Make It Easy for Donors to Skim Your Annual Report
Let’s be real. Nobody is curling up with your annual report and a cup of tea. Most donors open it on their phones, probably between meetings or as they wait for a flight at the airport, and give it about 30 seconds before deciding whether it’s worth their time to dive deep or close the tab. That’s it.
So it was never about cramming in every stat, story, and update. But instead, what jumps out when someone’s just skimming. Always design for the skimmer first, and everything else falls into place.
I went deeper on this in Why Donors Only Skim Your Annual Report, if you want the four ways to make donors slow down and really read.
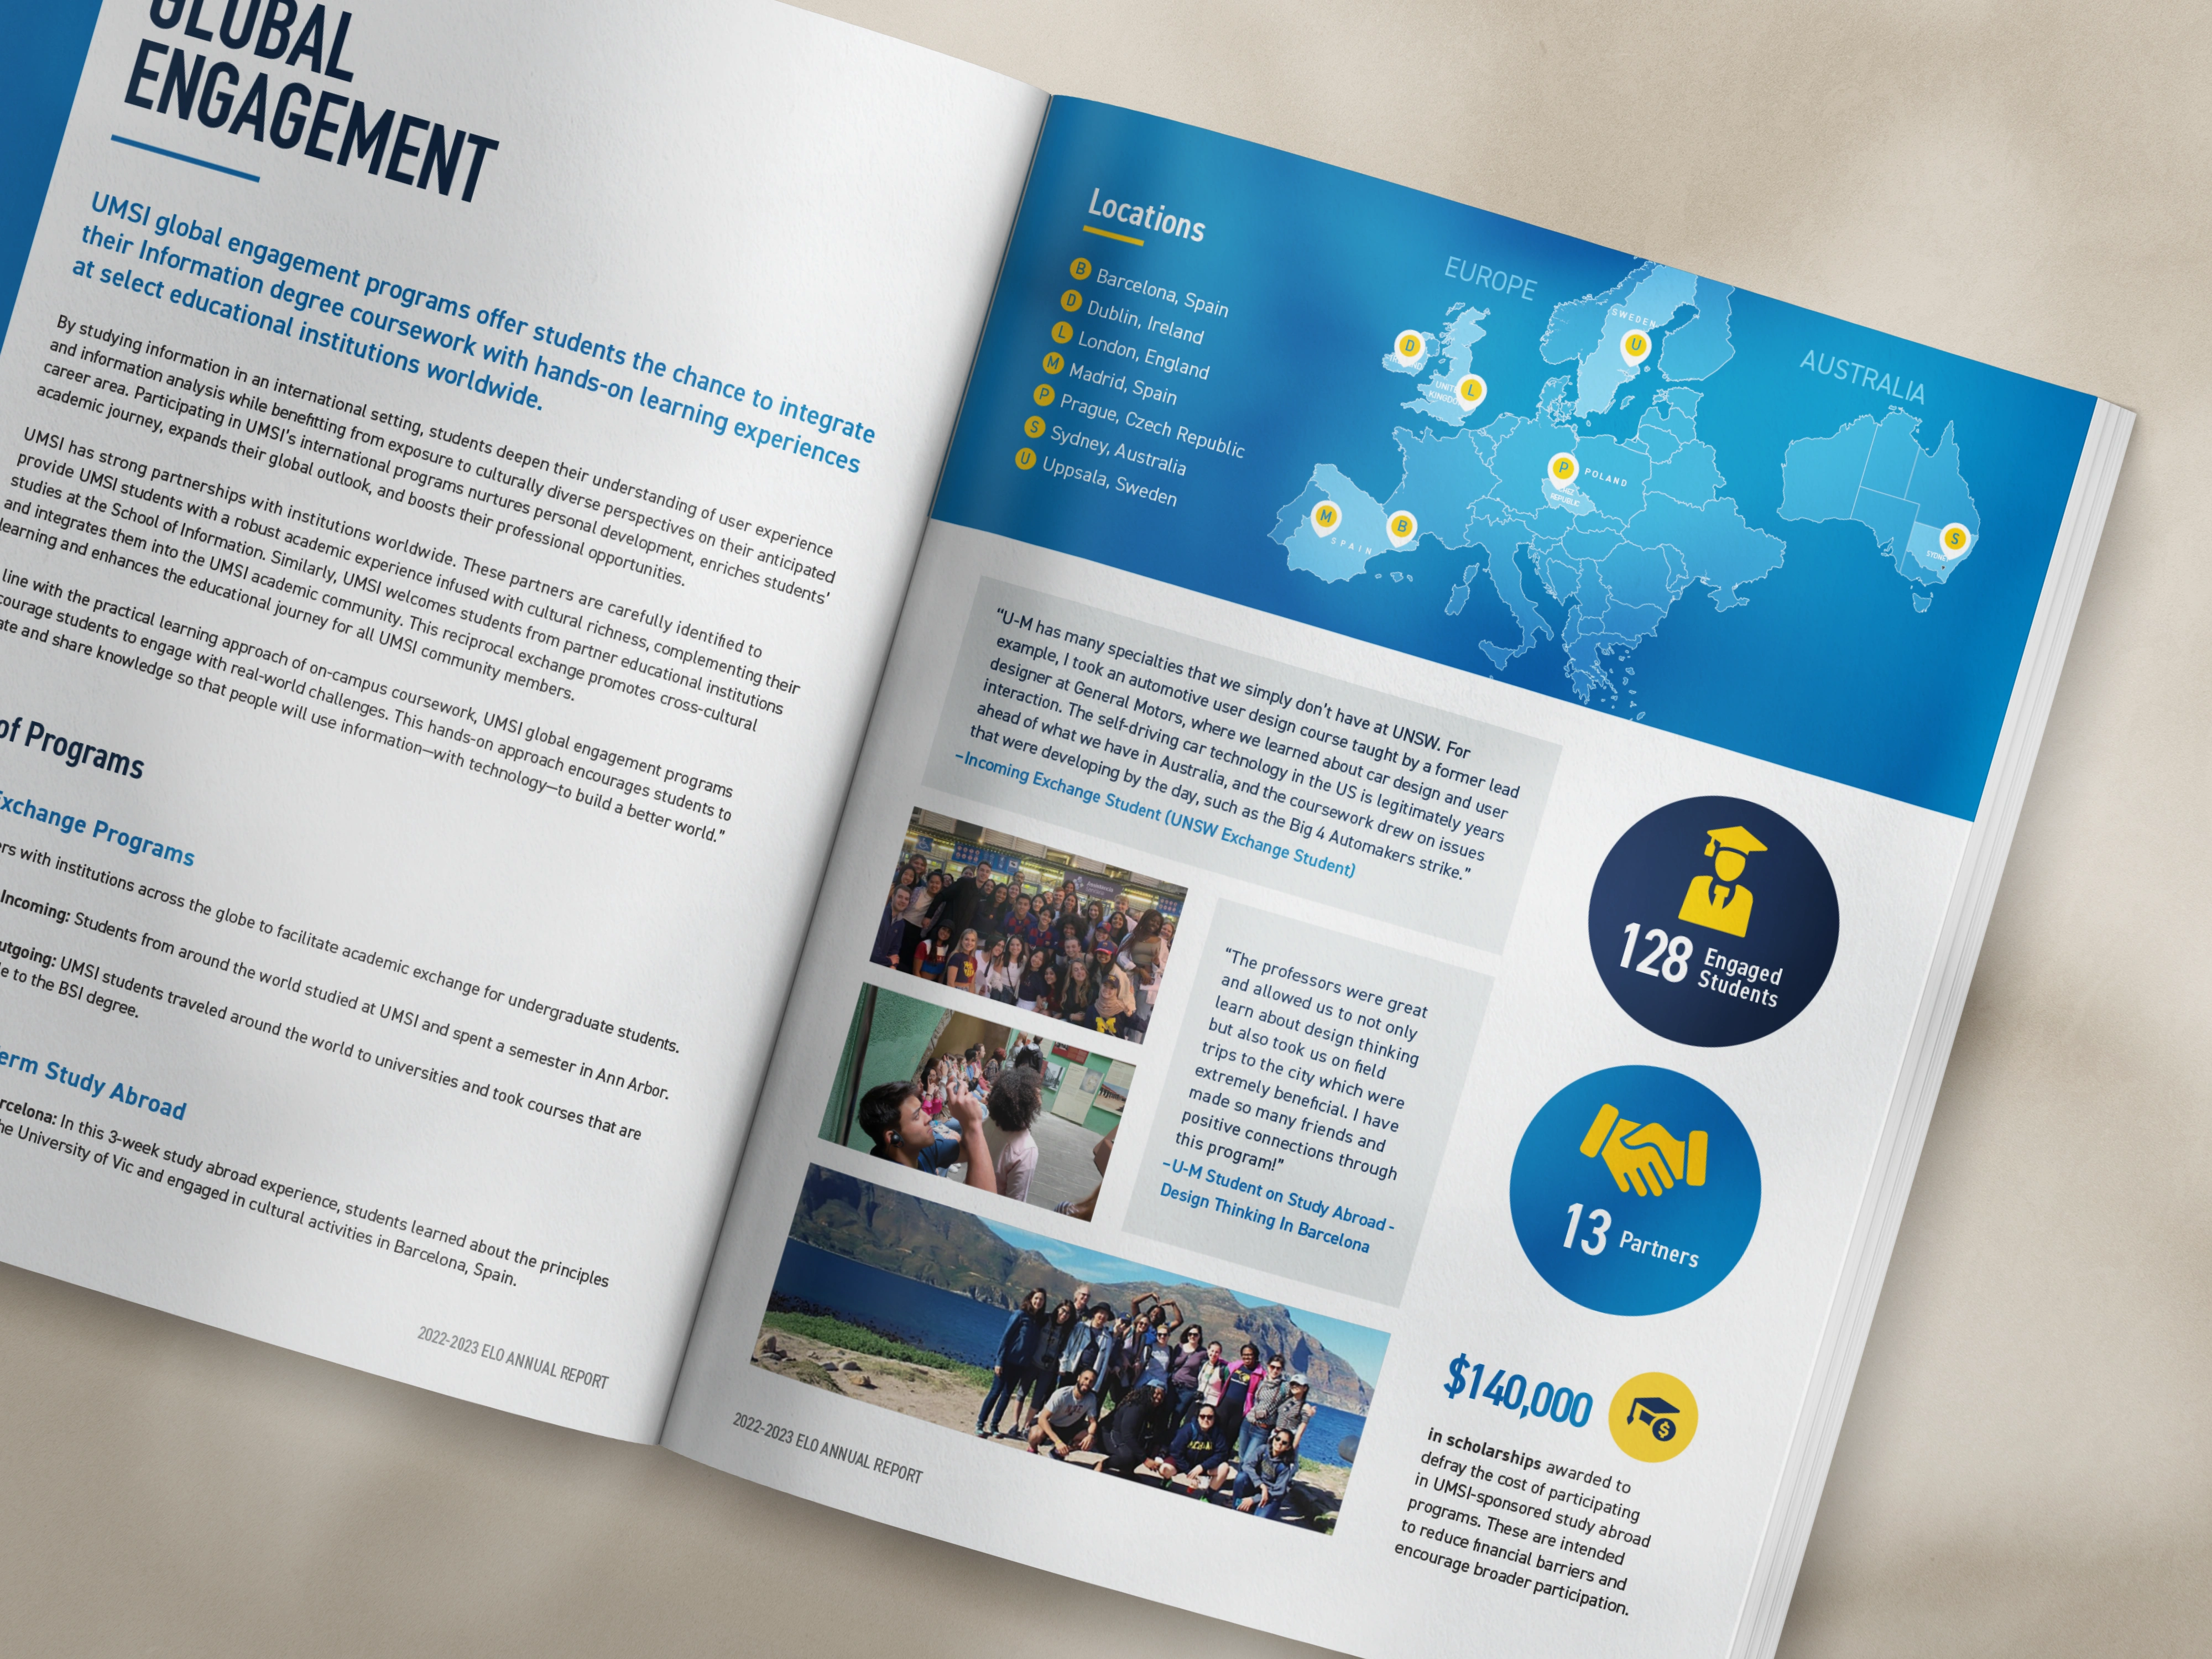
In practice, your most important info on each page should pop without anyone having to hunt for it. Use a headline, a big stat, or a pull quote that actually says something.
If your story is hiding in a block of dense copy, your busiest (and most generous) donors will never see it. Sure, a few will read every word, but most people are scanning headlines and photos. Put your best stuff there.
2. Use Your Report Cover as More than a Title Page
The biggest waste of space I see, in about 98% of reports, is the cover. So many teams treat it like a folder label: “2026 Annual Report,” a logo in the corner, maybe a less common stock image if the creators were feeling fancy, and that’s it. But the cover is the most-looked-at page in the whole thing, and you used it to... write the title? You can do better, and I’m here to share how.
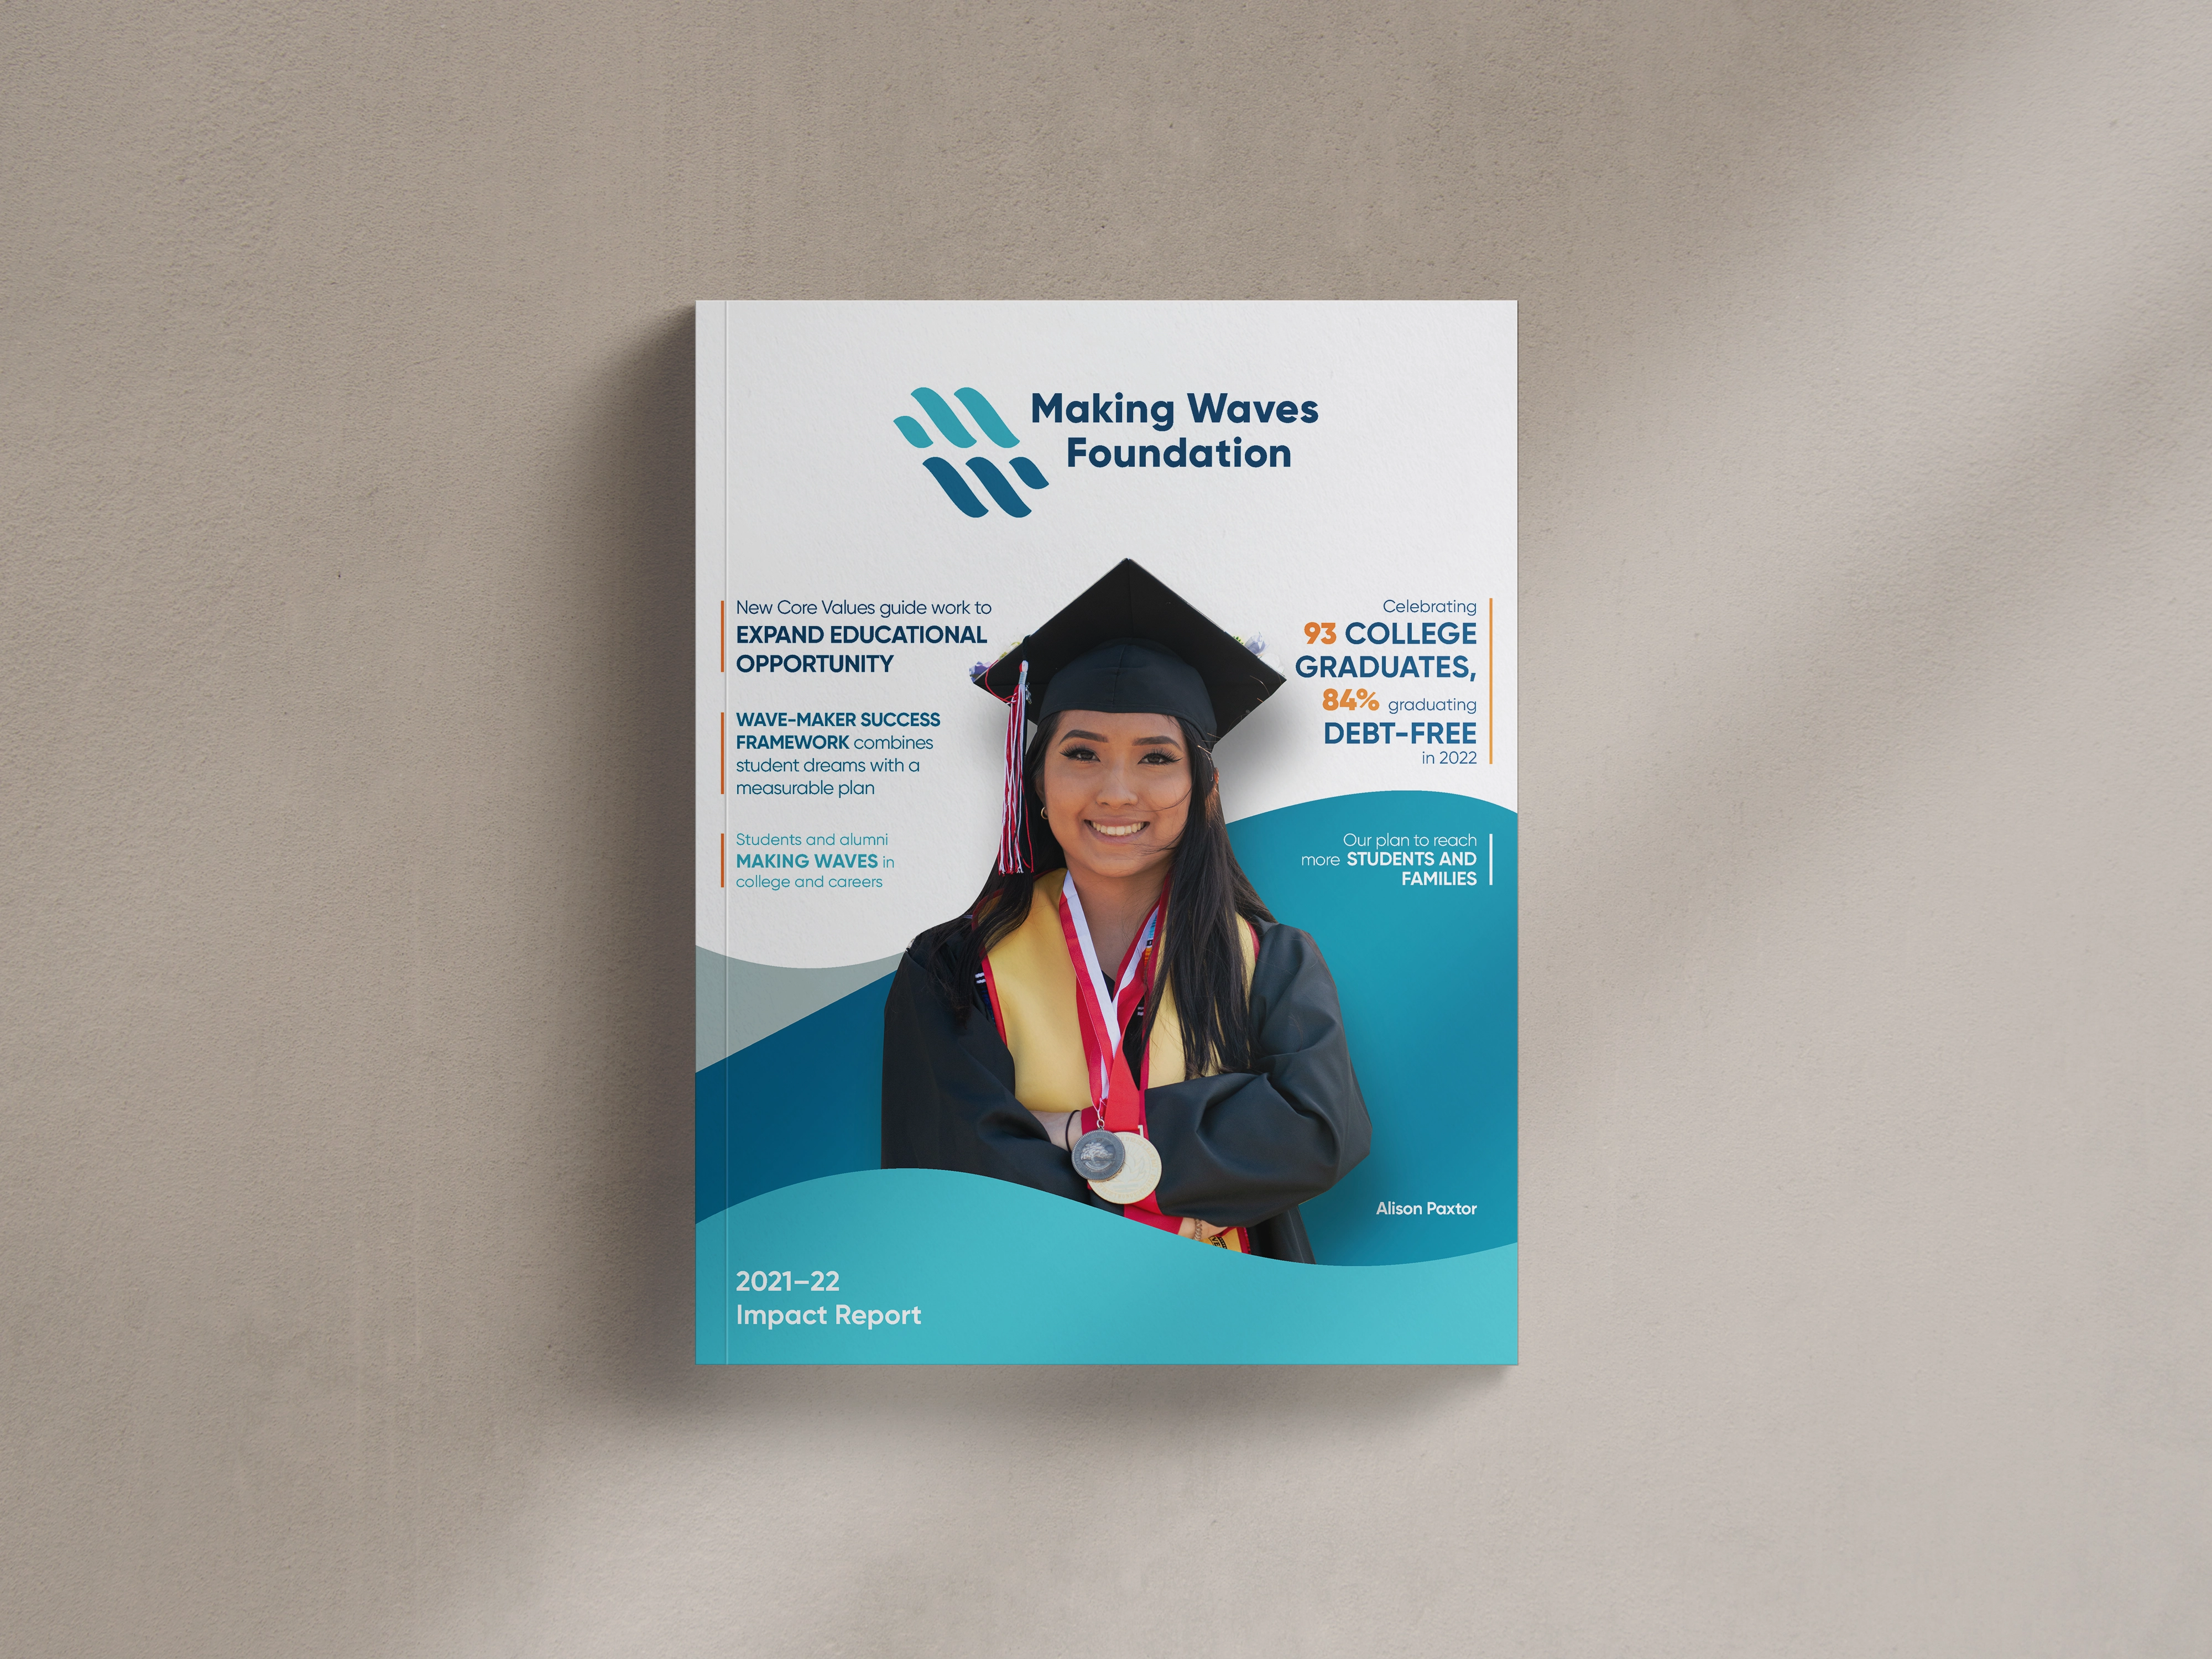
Give it a purpose. Show one person looking straight at the camera with a thought-provoking or informative line underneath that blows people’s minds. Use a collage of the real people you served this year. Do something that lets a donor feel the mission before they even turn the page.
The cover is the handshake. And like my dad told me: make it firm, make it count, make ‘em remember you.
3. Lead Your Design With a Face, Not a Fiscal Year
You know what’s wild? I was talking with an ED who told me they didn’t have much quantitative data but had really powerful human stories. And I’m like, “yo, that’s your ADVANTAGE!”
Hard data is always needed, but numbers alone don’t move people; people move people, and then the numbers come in afterward to reinforce your story.
So let your layout open with a person (a photo, a quote, a real story) before you ever get into the program breakdown.
“Maria has a safe place to sleep tonight, and so do 847 others” works because the human and their experience is front and center. Then, the number scales the feeling. Do it in that order and watch what happens.
There’s more on connecting your data to real humans in Visual Storytelling in Nonprofit Annual Reports and Annual Report Infographics: Examples & How to Use Them.
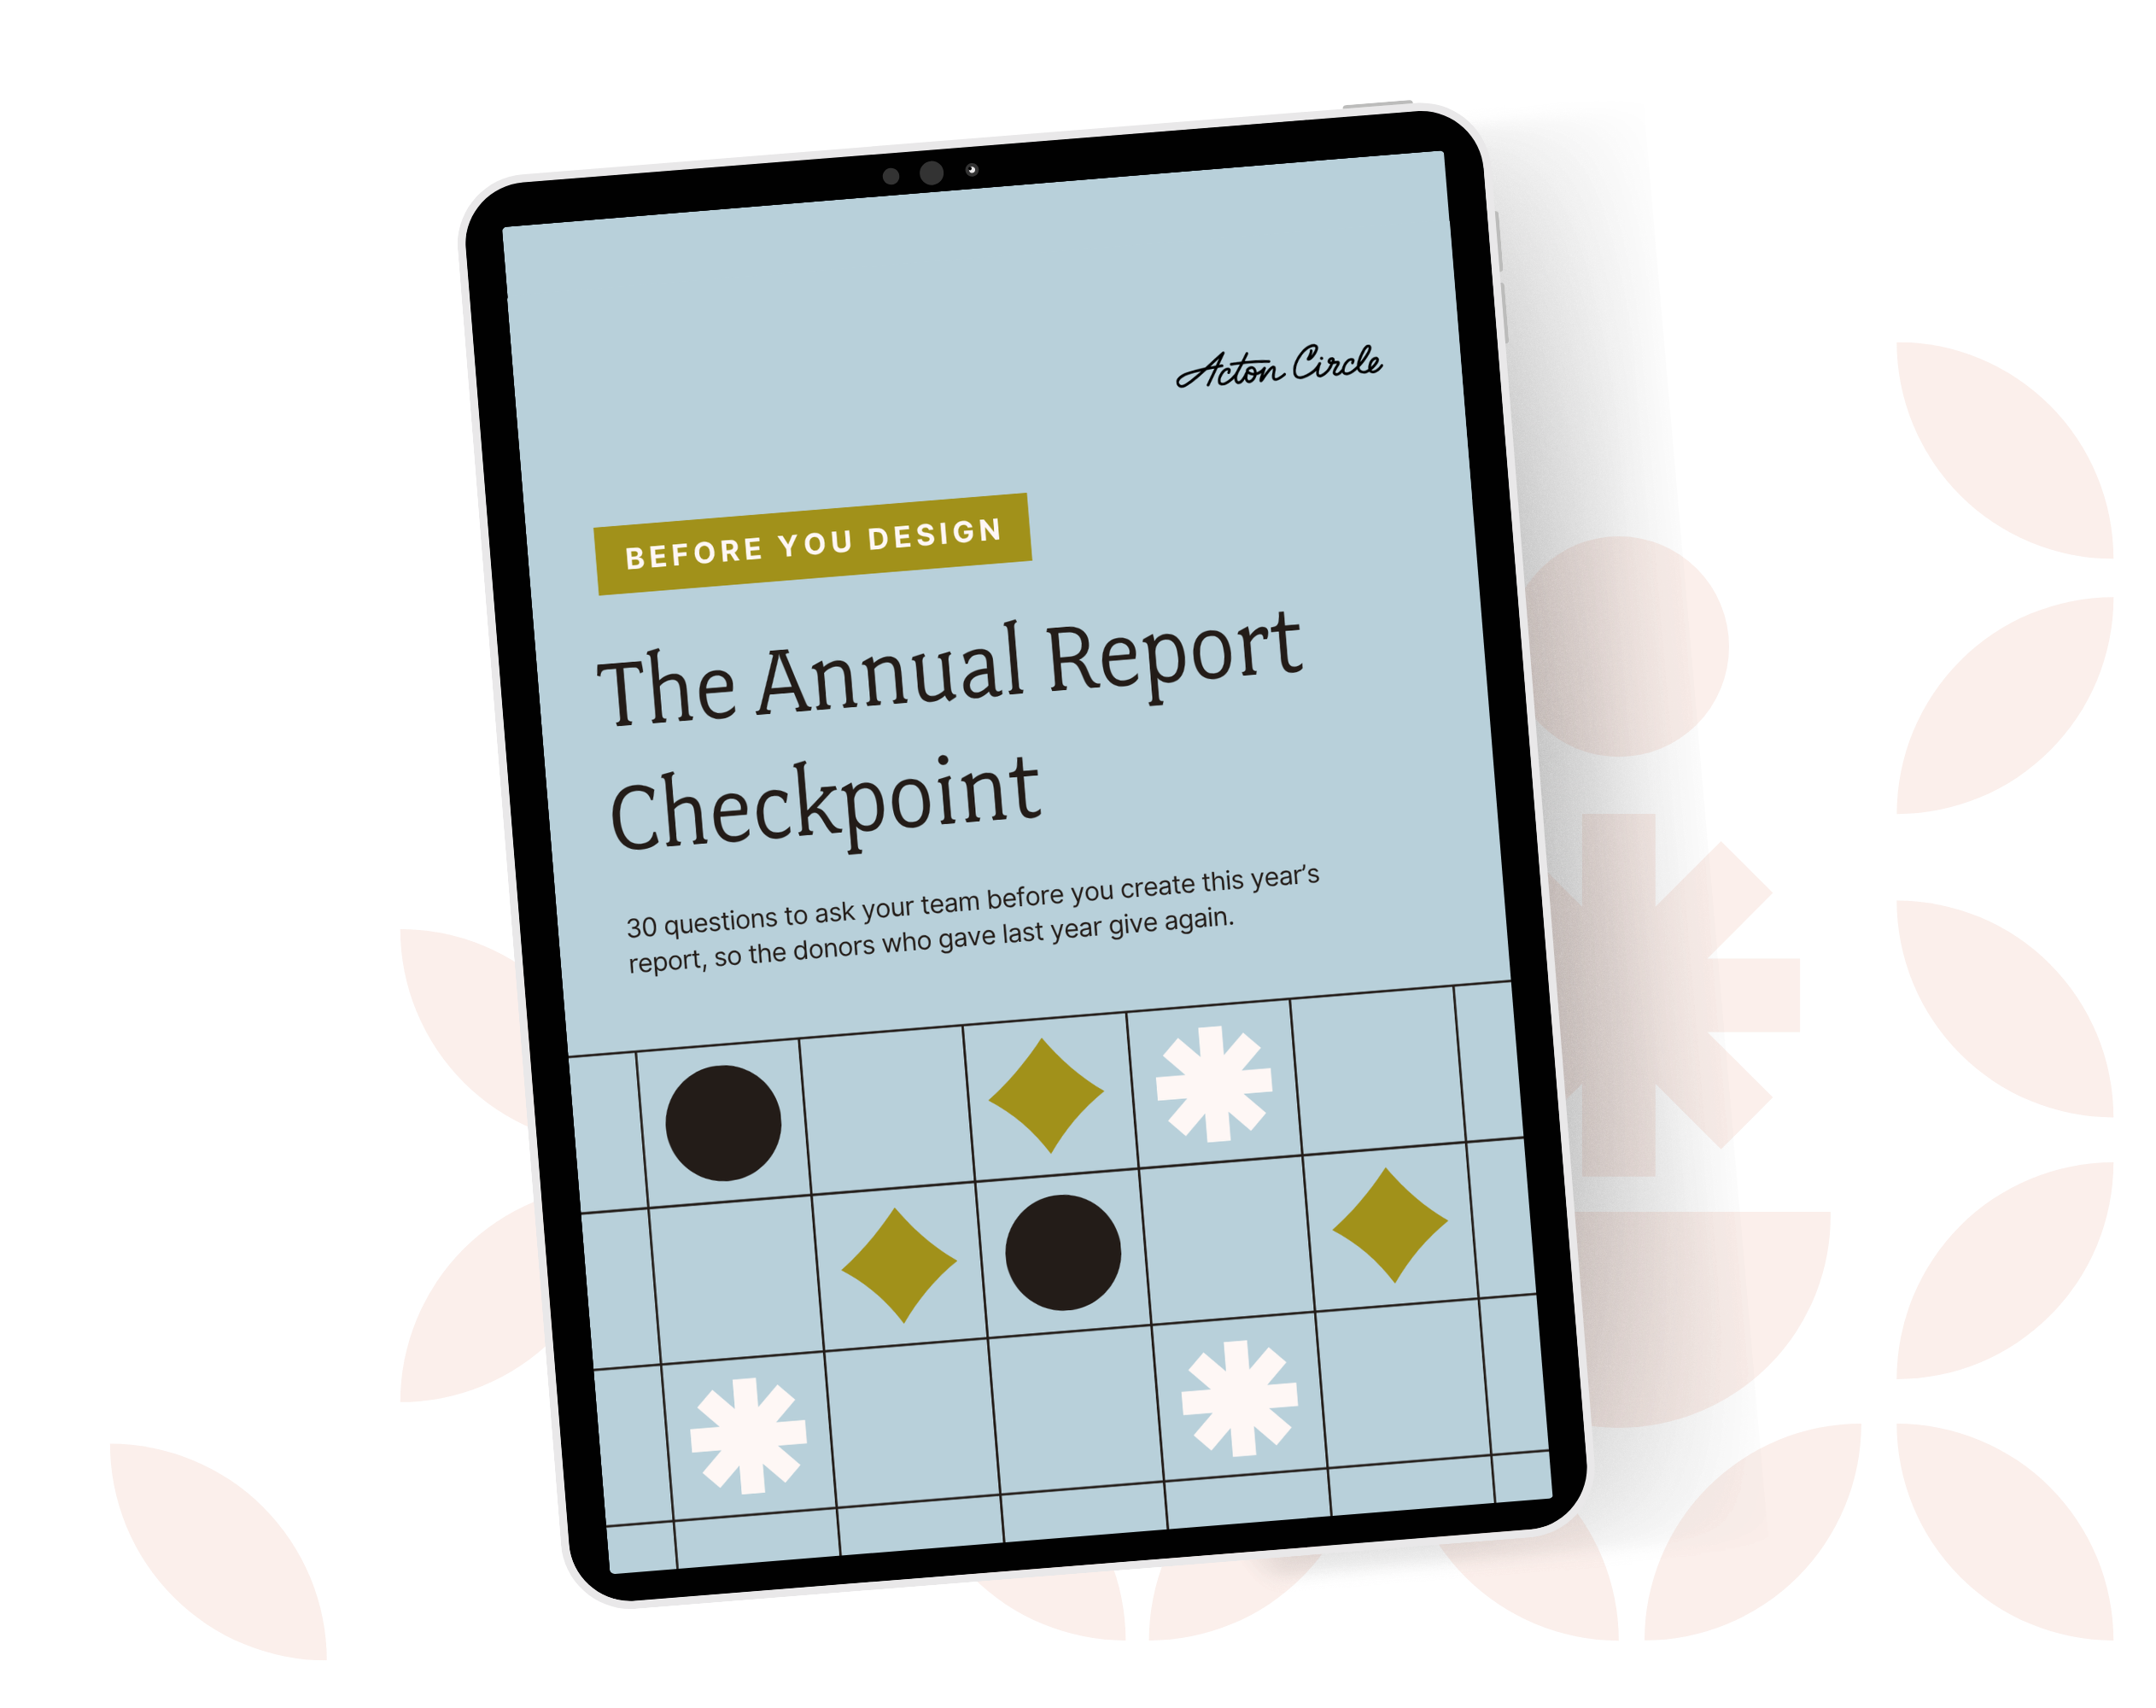
Get The Annual Report Checkpoint
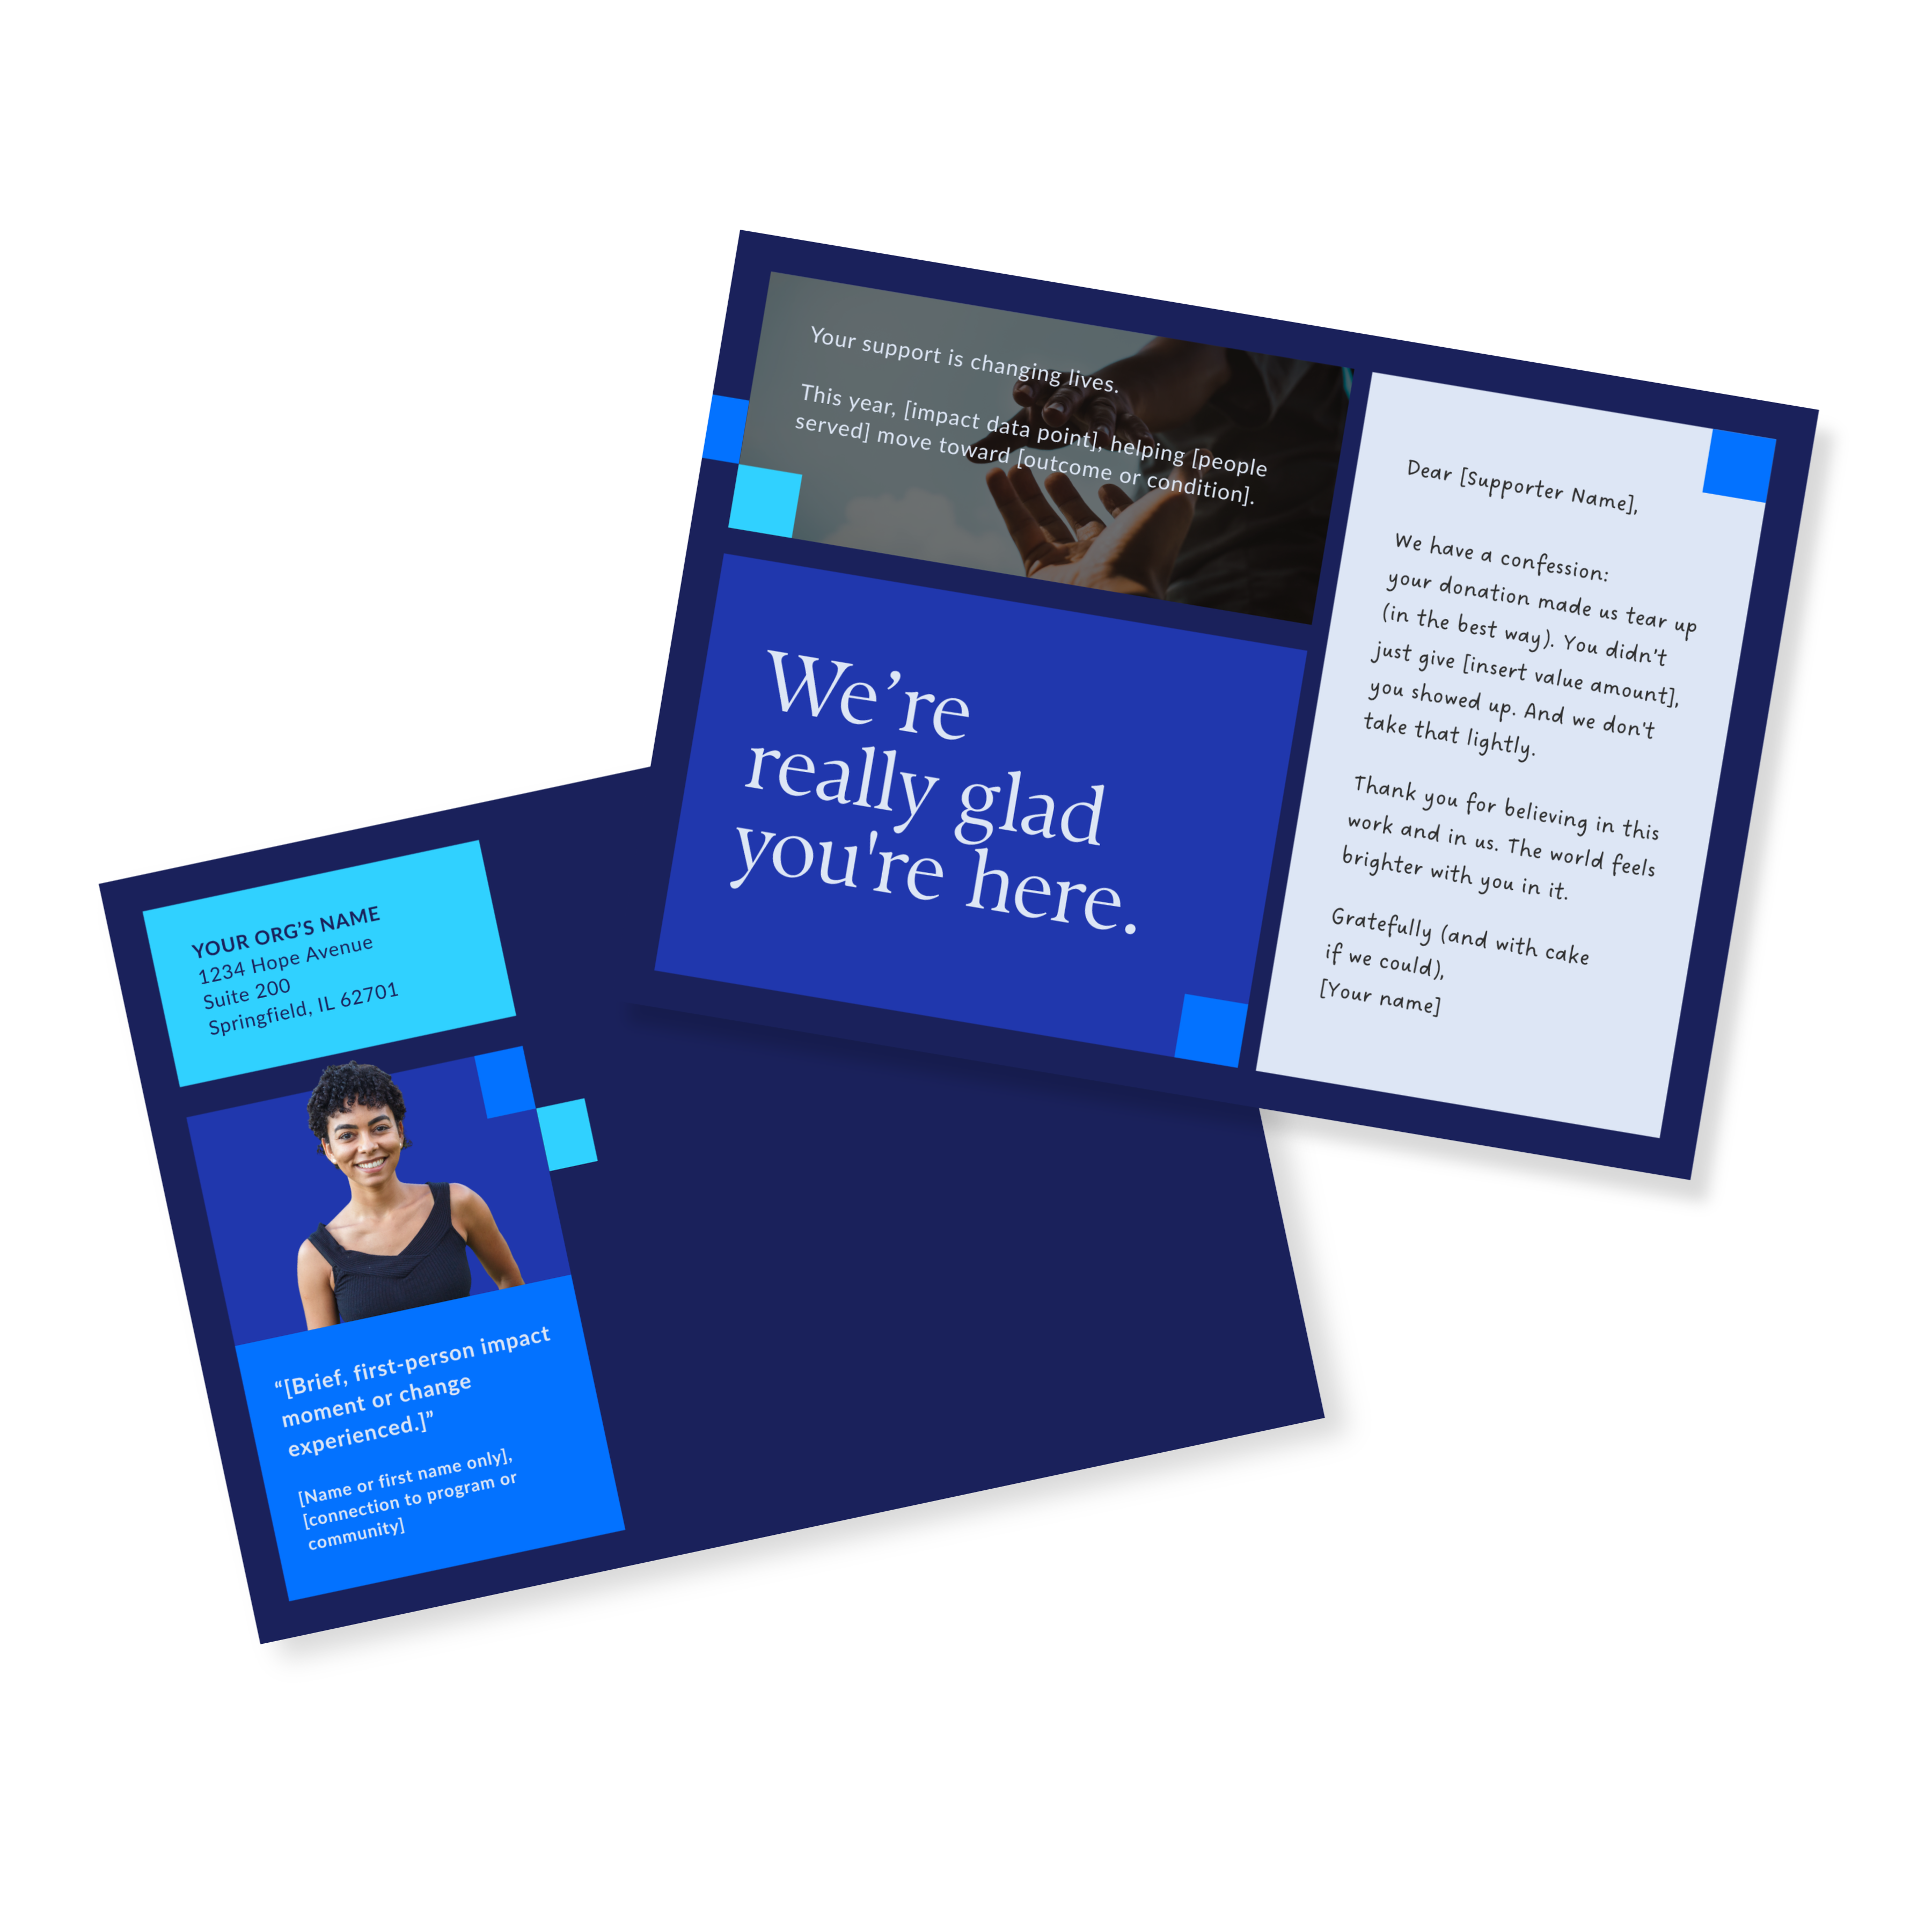
Donor Thank You Postcards Templates
Enter your info and we’ll send the postcards straight to your inbox:
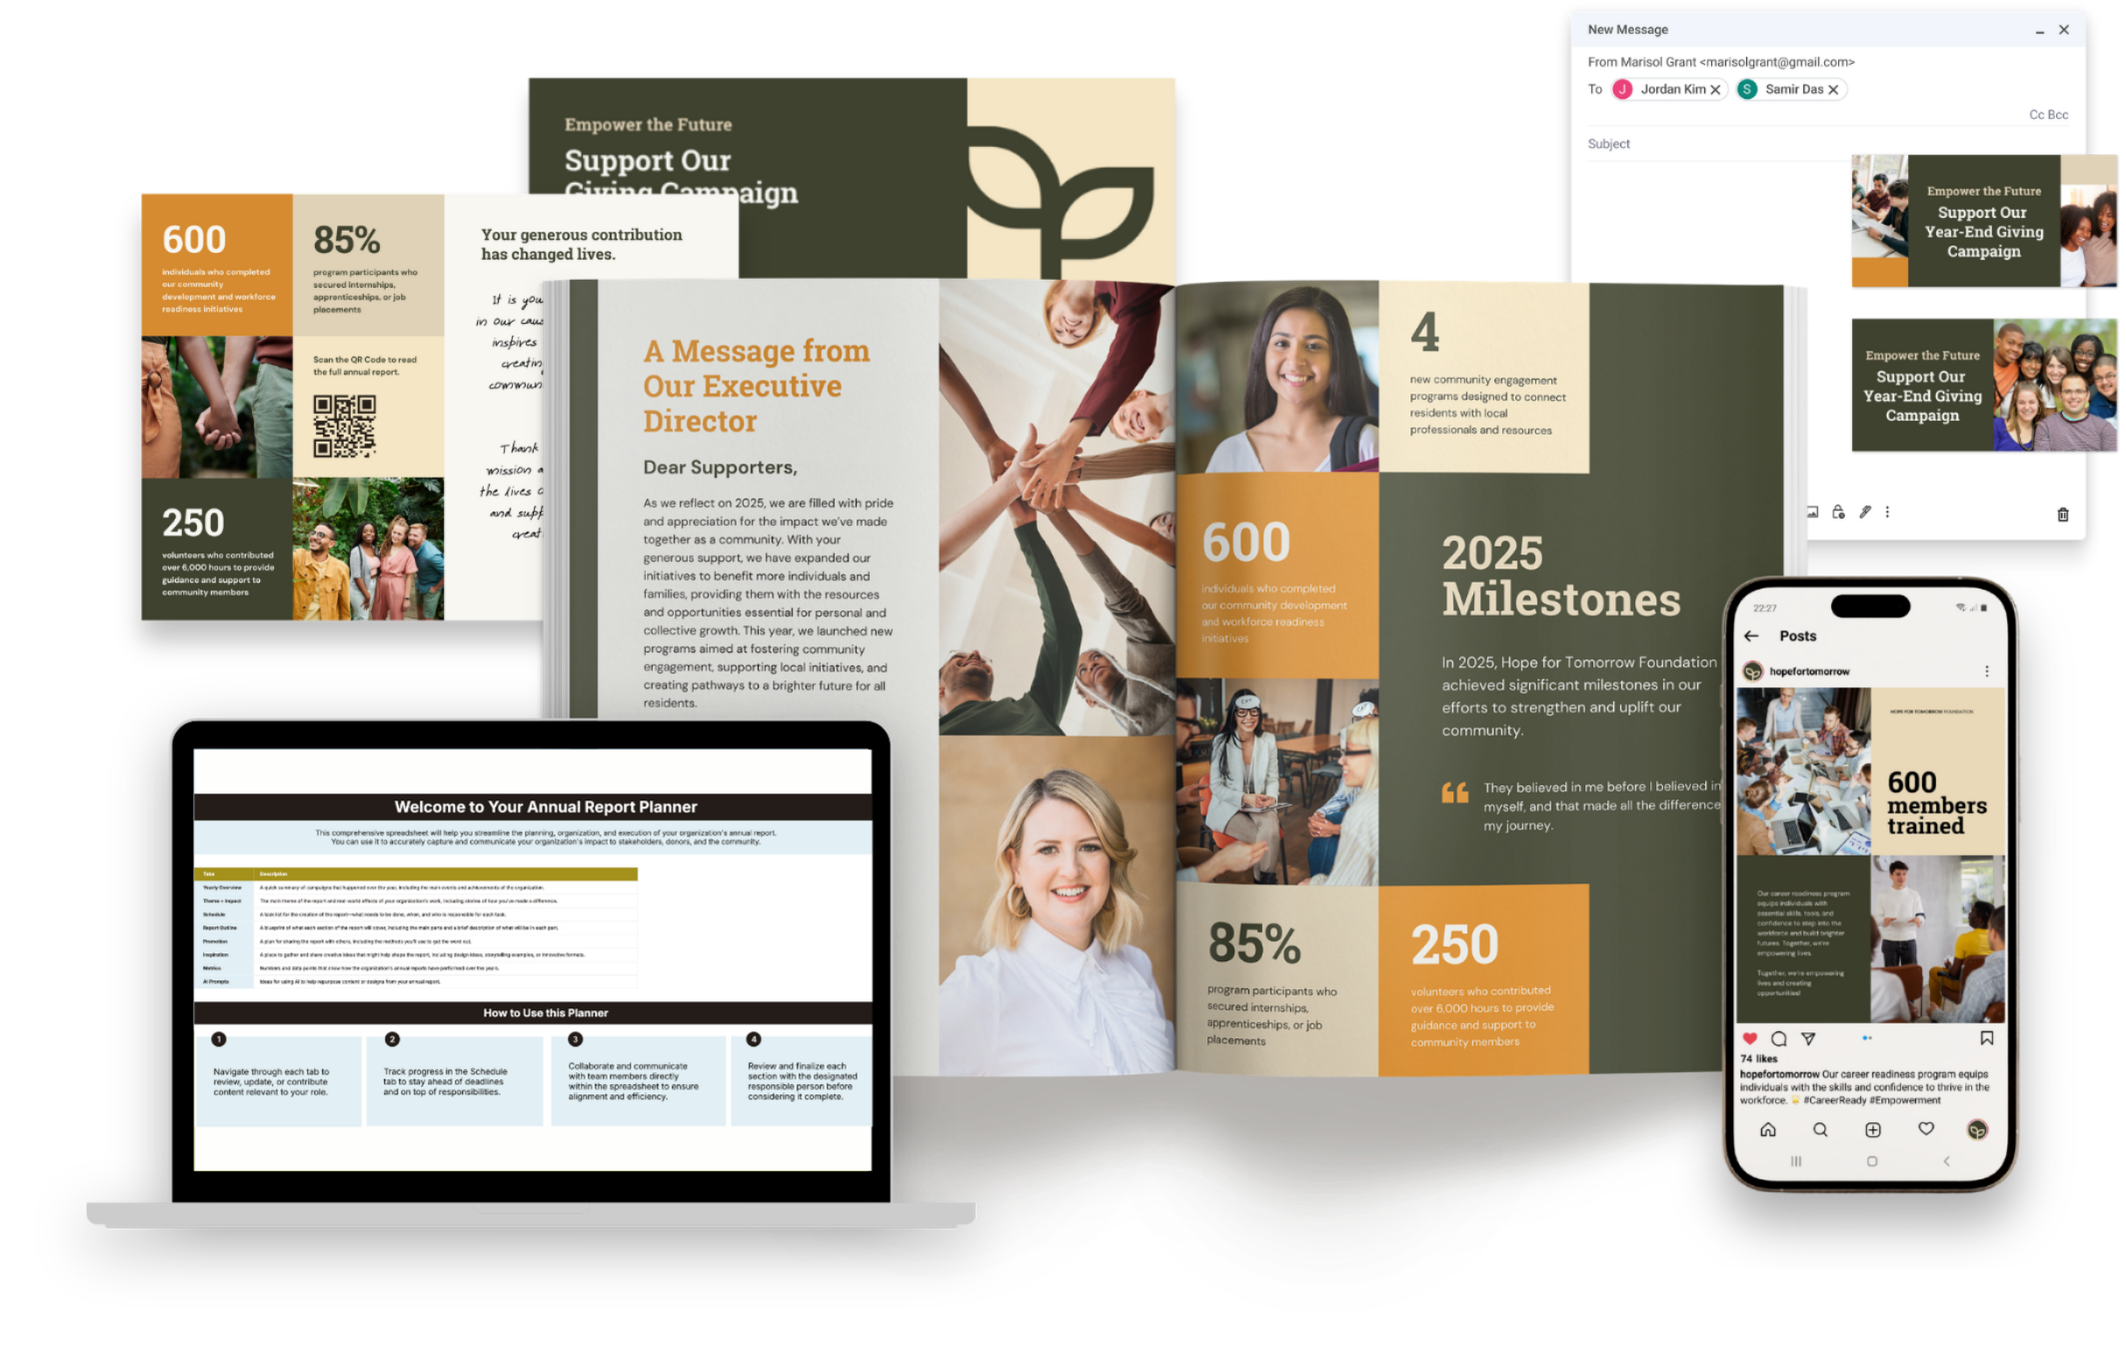
Annual Report Template Kits
Turn a folder of half-finished docs into a donor-ready annual report, without hiring a designer or pulling another all-nighter.
4. Embrace Negative Space as a Layout Choice
I know the instinct. You paid for the design, or you paid in lost sleep, so of course you want to fill every last inch. Please don’t. A crammed page reads as anxious and a little desperate.
A page with room to breathe definitely says, “We’ve got this, we’re organized, you can trust us.” When a donor sees generous margins, clean headlines, and a layout that isn’t yelling at them from all four corners, they trust you more before they’ve processed a single fact.
Negative space is one of the cheapest credibility signals you’ve got. That’s why it hurts me how often it gets thrown away.
5. Use the Same Fonts, Same Colors, Every Page
An established org I talked to recently is celebrating its 60th anniversary. Sixty years. And yet their reports make them look like a scrappy little startup running on grant fumes.
That’s the real cost of an inconsistent layout. Fonts that change page to page, colors that seem random, headers that resize for no reason anyone can explain. It makes a serious org look smaller and shakier than it is.
The fix is almost boringly simple. Two or three brand colors. Two typefaces (three if you’re feeling spicy). One headline size, one body size. The same margins on every single page. Is it a little boring to enforce? Sure. But that consistency is exactly what convinces a donor you’re as established as you really are.
Your annual report design should always make you look your actual size, never smaller.
The 30-Second Test Your Report Has to Pass
If a donor only skimmed your last report for thirty seconds, what would they believe about you? They’re deciding that right now, today, based on nothing but what they can see.
Your mission is too important to let the layout undersell it. You worked way too hard on the inside of that report to let the outside be the reason it gets ignored.
Want a layout that already does all of this for you (the skimmer-first hierarchy, the breathing room, the lead-with-a-face structure) without you designing it yourself? That’s exactly what I packed into the Annual Report Template Kits: a full report and a matching launch suite, designed with donor psychology baked into every spread, ready for you to drop your story into in Canva.
You bring the content, the system brings the rest.