If you’re a development or marketing director, you probably already know your annual report is meant to help with stewardship. You and your team spend three or four months creating it, send it out in the spring or fall, post it on your website, and sometimes use it in important donor convos (if all goes well).
That part’s not the issue. The challenge comes after the report is finished.
Over the past several years, I’ve worked with more than 60 nonprofit teams on donor communications, including community foundations, education nonprofits, advocacy groups, and social services. The pattern I see most often was summed up by a development director on a recent call:
“It’s kind of like checking a box rather than actually making it useful and purposeful.”
The missing piece is putting the report to use. You’ve worked hard to create the report. But often, the step where it’s used in new ways throughout the year gets skipped.
Why the Stewardship Gap Is So Expensive
Fundraising follows a cycle: identify a donor, build the relationship, make the ask, steward the gift, and then ask again. You’re probably great at making the ask. But stewardship (what happens after the gift) is something you can always improve. (I’ve seen this firsthand, both as a design partner and as a supporter.)
That lack of follow-up is expensive. It costs 5 to 10 times more to acquire a new donor than to keep one. Every donor who leaves because they haven’t heard from you adds to the loss.
The seven-figure case for your annual report (seriously)
Your annual report is one of your strongest stewardship tools. It should help donors feel seen, valued, informed, and proud of their support. When you use it often and share it repeatedly, it can do this well. If it only sits on your website, you’re truly missing an opportunity.
I was on a call recently with a director at a private school that produces a donor/alumni magazine every year (similar to an annual report). He mentioned that the magazine has been responsible for multiple seven-figure gifts from alumni. Sometimes it’s the only touchpoint they have with certain donors. That’s it. The publication lands in someone’s mailbox, they flip through it, and they call to set up a meeting. Or they leave the organization in their will.
One document. One relationship tool. Seven figures.
This is what happens when you design your communication with purpose and make sure it reaches the right people at the right time. When you focus only on creating the report but forget to share it effectively, it’s not really doing its job.
What you lose when report stewardship doesn’t happen
Your report was probably created under pressure... with a tight timeline, late content, and long stakeholder reviews. By the time it’s finished, the team is just glad it’s done. Making a plan to use it can feel like another task on an already long list.
But this gap between creating the report and using it is where donor retention is affected. The period right after a gift is when donors are most engaged. If nothing happens during that time, they may lose interest.
Another director recently told me her organization’s report “hasn’t really been utilized fully, it’s kind of been this thing that the advancement team does.” She was new to the role and was already working to change that. She had the right idea, but the right system wasn’t in place yet.
Every other guide will tell you how to make a great annual report. This one is about what to do with it once it exists.
.avif)
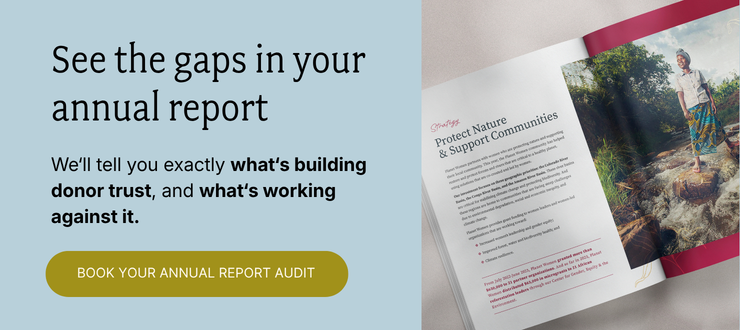
Get The Annual Report Checkpoint
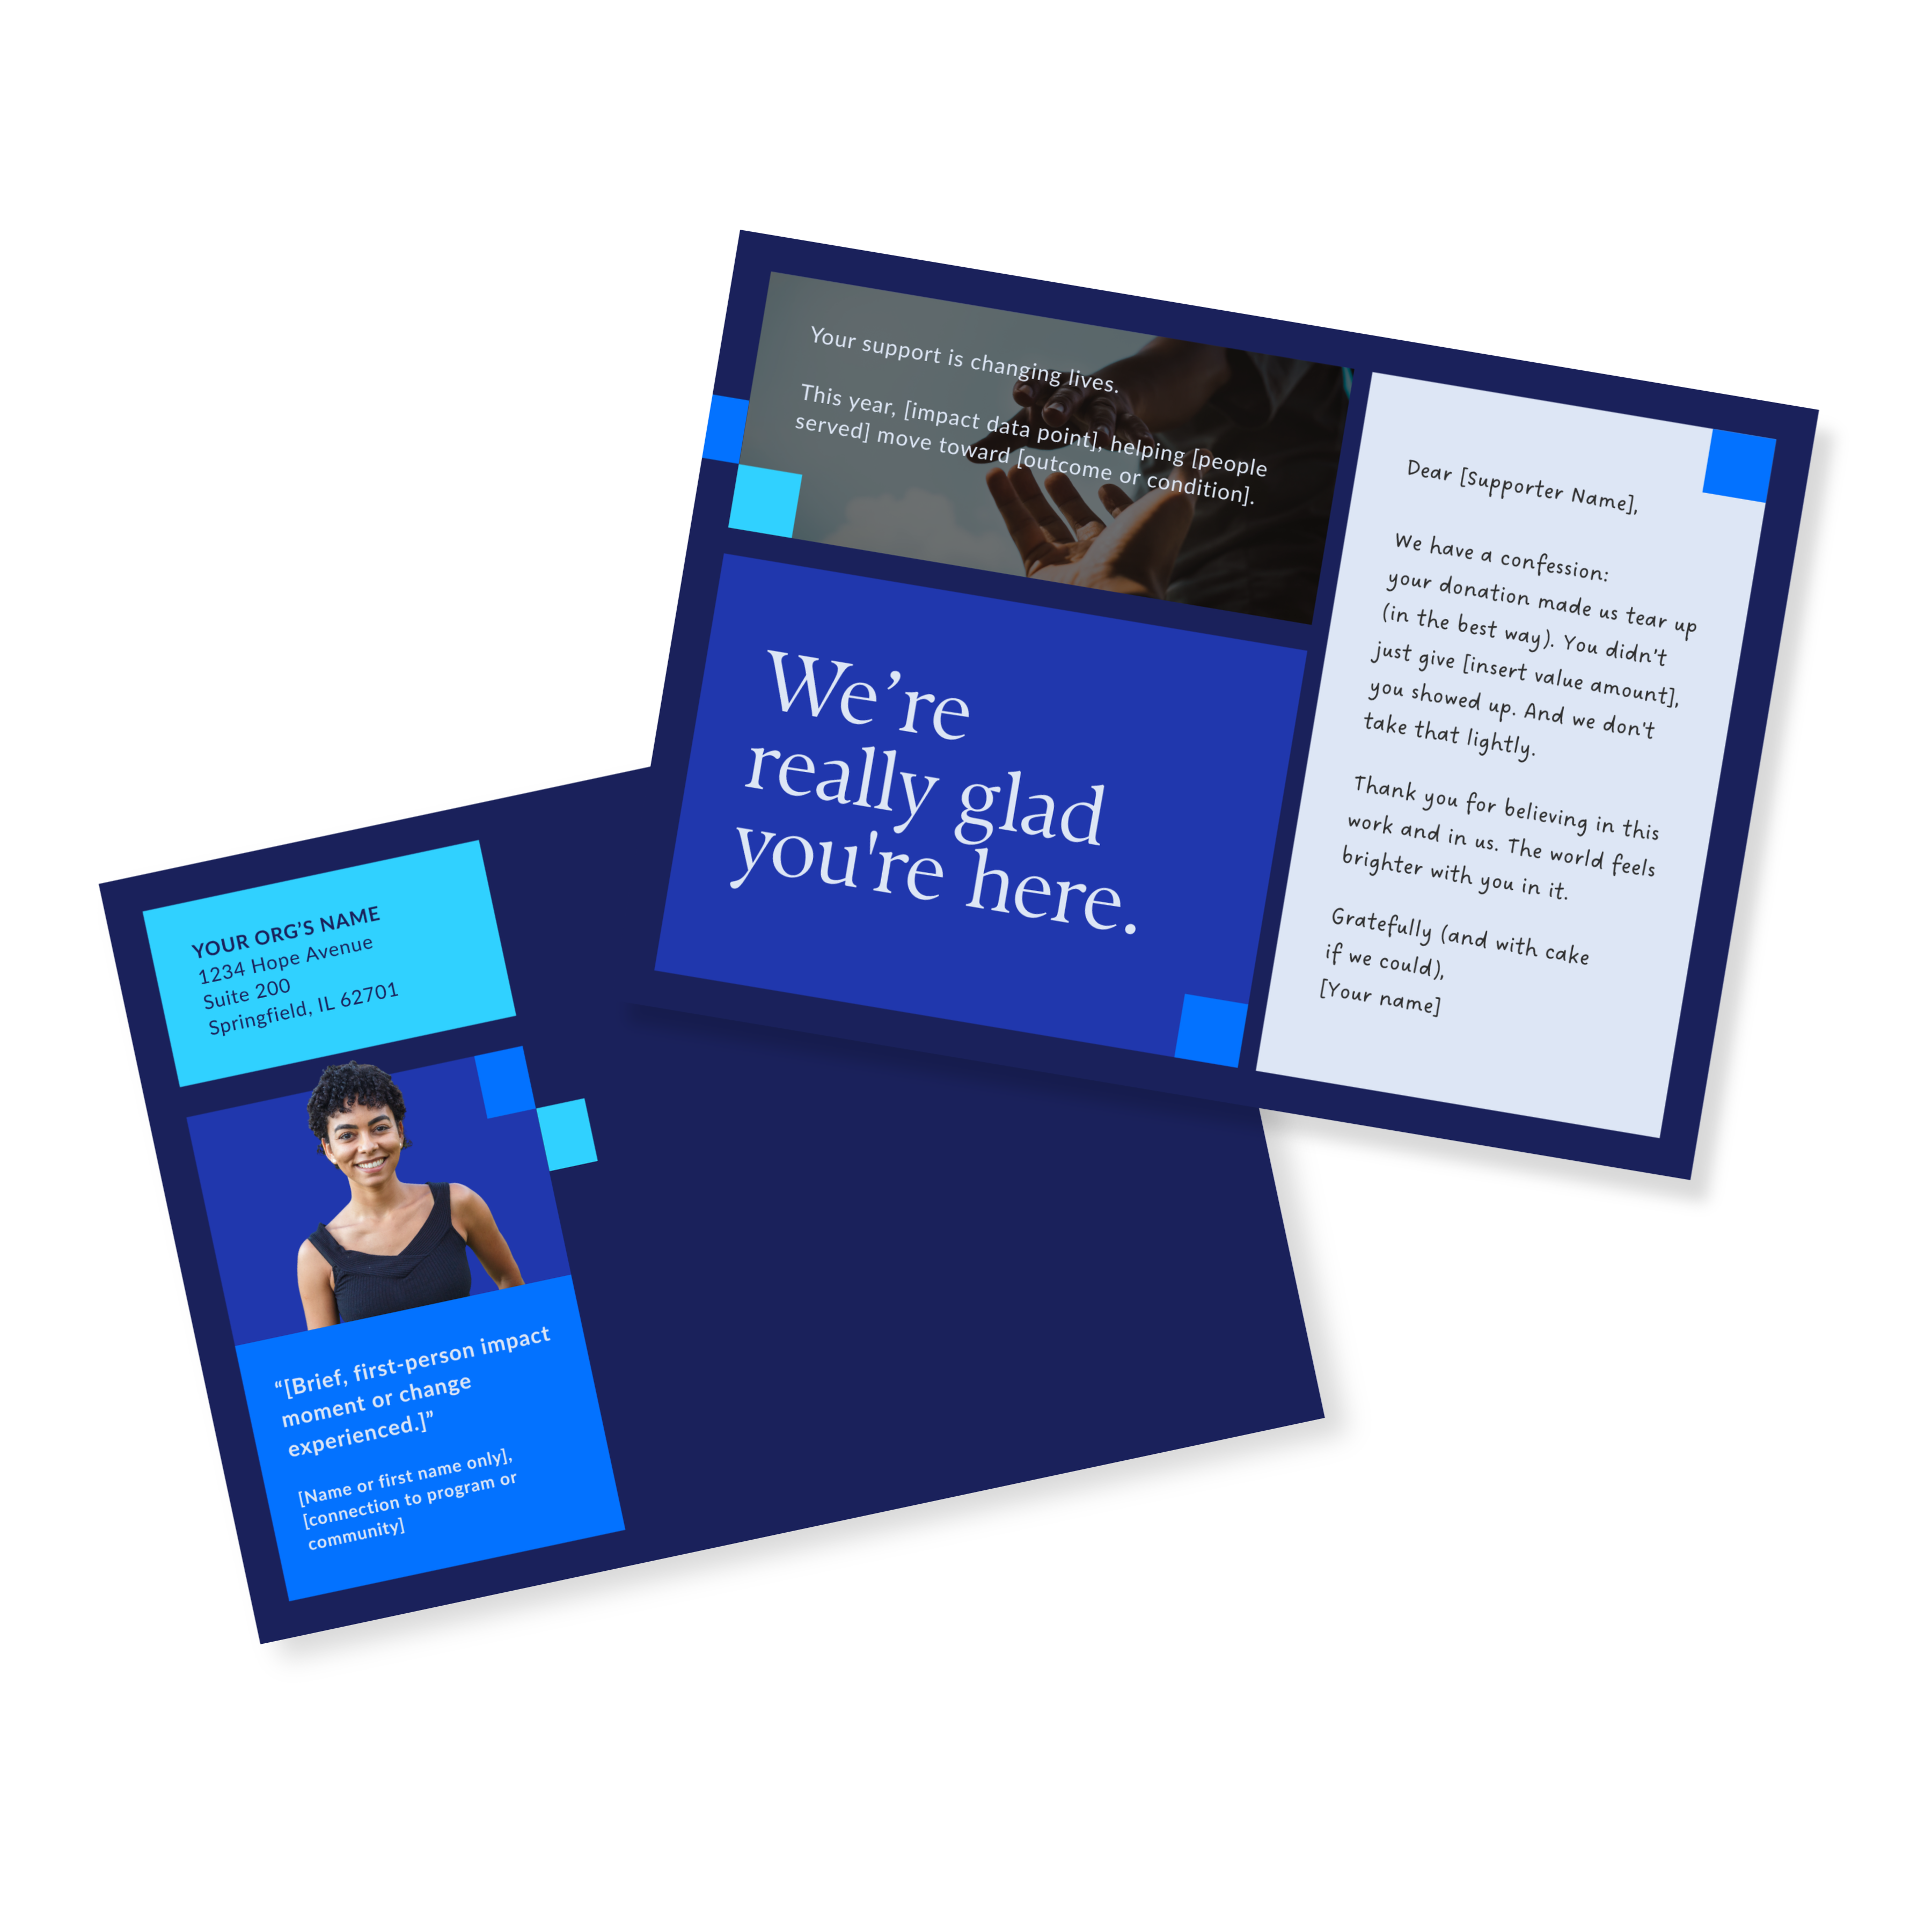
Donor Thank You Postcards Templates
Enter your info and we’ll send the postcards straight to your inbox:
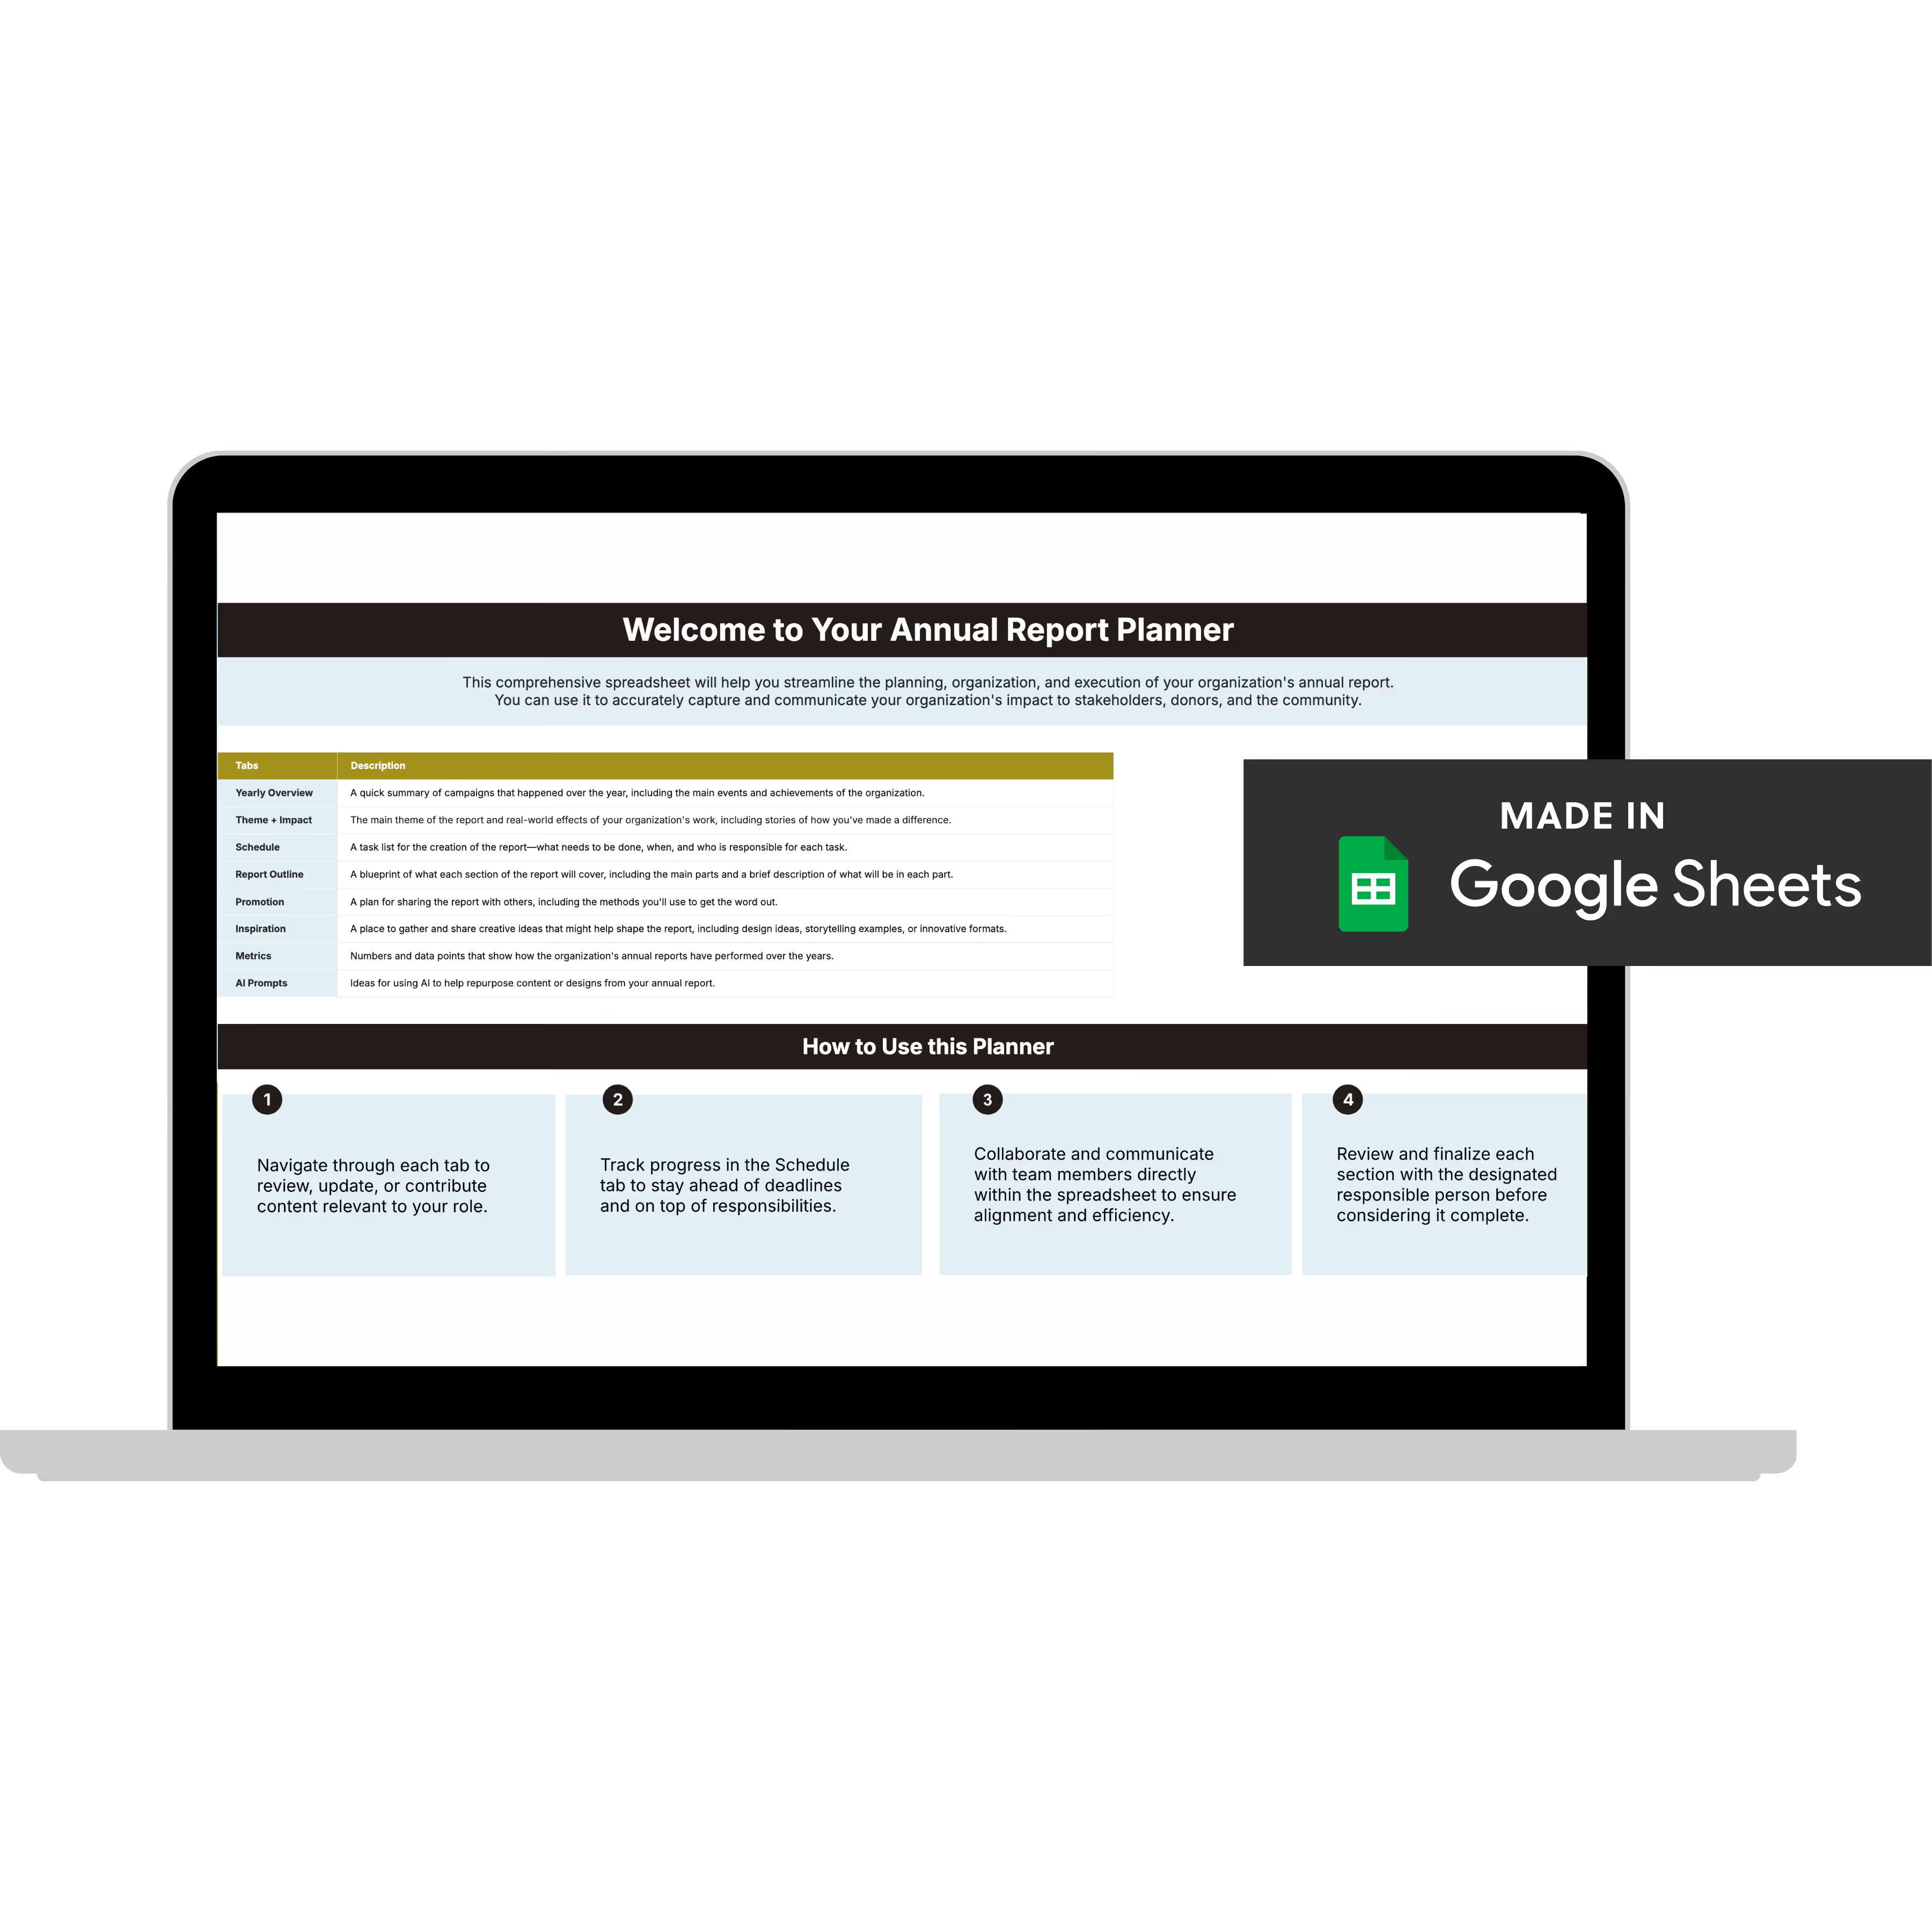
Annual Report Planner
Get a clear content roadmap so your annual report builds belief, earns trust, and actually gets used after launch—plus the same planning approach we use with our 1:1 clients, built in.
What Active Stewardship Distribution Looks Like
To build lasting donor relationships, use your report throughout the year, not just when it’s first released. Below, we go through exactly what you can do to start.
Send a printed copy to your top donors with a handwritten note
Not your whole list, but your top 25 or 50. A designed, printed report in someone’s hands registers differently than a PDF link in an email.
Bonus points if you add a short handwritten note that references something specific: their history with your org, a program they’ve supported, something personal. That combo costs almost nothing beyond printing and says that they’re not just a name on a list.
Use it to re-engage lapsed donors
Don’t just email your list. Do that, but also use your annual report as a reason to reconnect with donors who haven’t been in touch.
Many lapsed donors stopped giving because they felt forgotten when communication ended. Letting them know you wanted to share what happened this year is a great way to reconnect without asking for anything.
Bring it to major donor meetings
The report is what stays on the table after your ED or board member leaves a major donor conversation. It keeps working after the meeting ends.
From my experience with many clients, donors often look through the report on their own and form opinions right then. The design, stories, and layout all send a message about your organization, even when no one is there to explain it. Most teams don’t consider this when designing their reports, but that moment when they’re reading at their kitchen counter is when they decide if they trust you.
Send it to prospective funders before a grant conversation
Don’t wait until the grant application to make a first impression on a foundation program officer.
Sending your annual report before a meeting helps set the stage for your organization. It shows you are organized, transparent, and able to communicate your impact clearly. That’s the impression you want, so take the initiative.
Reference it on donor calls throughout the year
When a donor hears from you in October about something that happened in January, they feel like an insider.
Your executive director can share a few highlights from your impact report to make the call feel intentional. Share a story or mention a key number. That’s all it takes.
Pull from it as a content library all year (our favorite!)
Every story in that report is a social post. Every statistic is a caption. Every program highlight is an email.
The orgs I see retaining donors year over year keep impact visible throughout the year. They’re pulling from the report constantly, not just the week it dropped.
FAQs About Your Annual Report as a Stewardship Tool
How do we start with report stewardship? What does a put-it-to-use plan actually look like?
Start with your donor list and a highlighter. Pull your top 100 donors and your lapsed donors from the last two years. Those are your two highest-priority audiences, and they need completely different approaches.
Send top donors a printed copy with a personal note. Reach out to lapsed donors with a friendly, no-pressure email that uses the report as a reason to reconnect.
Next, create a simple content calendar. Share one story or statistic from the report each month on social media or by email (or both!). You don’t need anything complicated—just make your list, plan for each group, and choose someone to manage it.
How do I get my team on board with using our annual report as a stewardship tool?
Show them the math. If it costs 5 to 10 times as much to bring in a new donor as to keep one, every lapsed relationship is a real dollar amount walking out the door.
The annual report isn’t extra work on top of stewardship; it is the stewardship. Frame it that way in your next team meeting. It also helps to pick one tactic to start (the printed copy to top donors is usually the easiest win) and do that well before adding more.
How do we know if our report stewardship is working?
Track the things you’d track in any stewardship effort: renewal rates for donors who received the report versus those who didn’t, response rates on lapsed donor outreach that references the report, and whether major donor meetings that included the report as a leave-behind converted differently.
You won’t have perfect data right away, but you’ll start to see the pattern.
What’s the most common obstacle to using an annual report as a stewardship tool?
Capacity, almost always. The report finishes late, everyone’s exhausted, and the put-it-to-use plan never gets written.
The fix is building the distribution plan before the report is done, not after. Decide in advance who gets a printed copy, who gets a personal email, and what the content repurposing calendar looks like. When the report goes live, you’re executing a plan you already made, not starting from scratch.
Do we really need a different annual report approach for different donors?
Yes, but it doesn’t have to be complicated.
Major donors get something personal and physical. Mid-level donors get a thoughtful email that references something specific to their giving history. Lapsed donors get a low-pressure touchpoint that leads with impact rather than an ask. Prospective funders get it before a meeting as context.
You’re not creating four different reports; you’re delivering the same report four different ways based on where the relationship is.
Making the Report Is One Thing. Putting It to Work Is Another.
Here’s my POV after doing this work for years: the organizations with the strongest donor relationships build the report knowing exactly how it’ll be used. In whose hands? At what moments? In which conversations?
That changes decisions throughout the design process—like what goes on the cover, how data gets visualized, and whether the report feels like something worth sliding across a table to a major donor or something you attach to an email and hope they open.
Most annual report design advice focuses on what to put inside (we care about this, too). But the question that drives the work at Acton Circle is: where is this report going to be when it matters most, and is it built to do its job in that moment?
Making the report is the starting line, not the finish.
We design annual reports around the moments that matter most, like the major donor meeting, the lapsed donor outreach, and the grant conversation. If that’s what you’re looking for, start with our Annual Report Audit.