All Data, Limited Stories. How One Education Nonprofit Finally Made Its Impact Connect.

Written by

Olivia Wheeler

/

Updated

September 19, 2026

Here is a sentence that should worry any comms director: people read our annual report and still don't know what we do.

That is not a design problem on the surface. But it usually shows up in the report first, because the report is where an organization tries to explain itself in one place.

The National Center for Teacher Residencies (NCTR) named it out loud. Their past reports were, in their words, all data and no stories. The numbers were impressive. The understanding wasn't there.

2.2 Million Students of Impact, and People Still Asked What They Do

NCTR has backed teacher residency and apprenticeship programs across the country since 2007. Roughly 2.2 million students and more than 16,700 teachers have been touched by that work.

And STILL, two gaps kept showing up. Some readers didn't know what a teacher residency actually is. Others knew, but couldn't see where NCTR fit into the picture.

Their earlier reports didn't close either gap, because a page of strong numbers assumes the reader already understands the thing being measured. If they don't, the numbers are just... numbers.

The team had the data. They had the stories too. What they didn't have was the internal capacity or the outside lens to shape both into something a donor could follow in one sitting. Their year was already full. And the complete data was going to arrive late, which meant the design partner had to be flexible about sequence instead of waiting for a tidy handoff.
What a Story-First Report Actually Looks Like

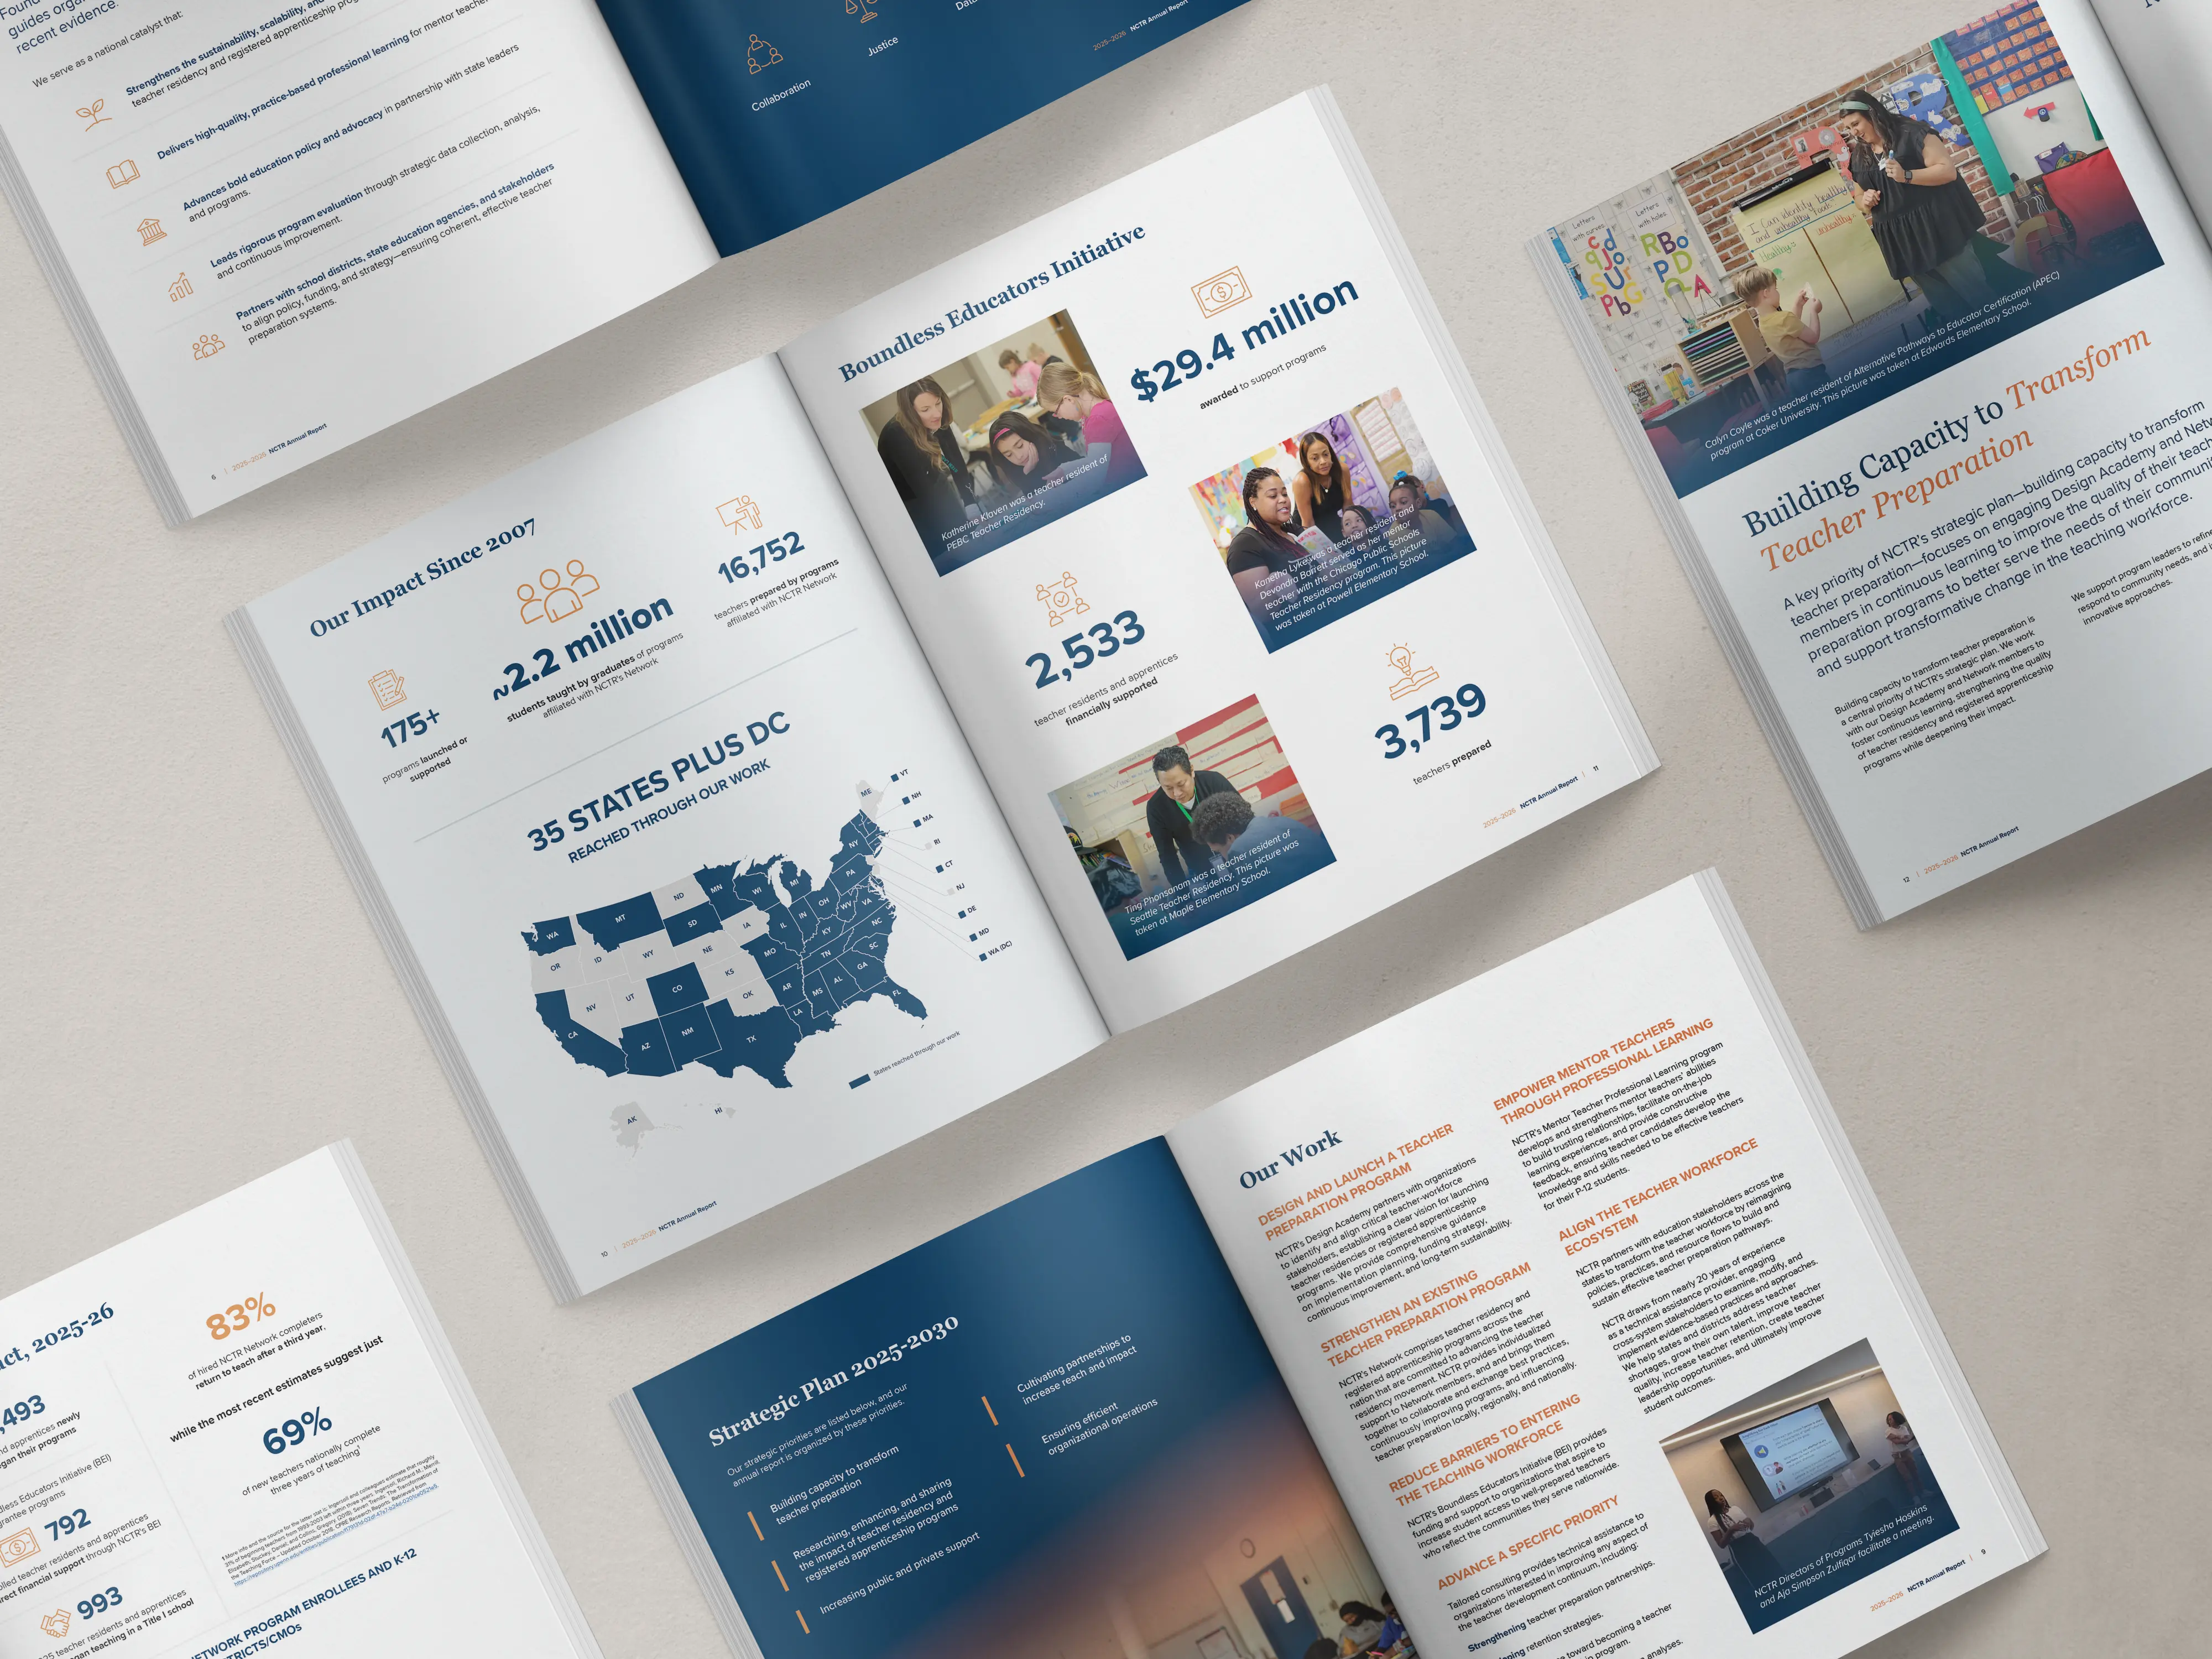
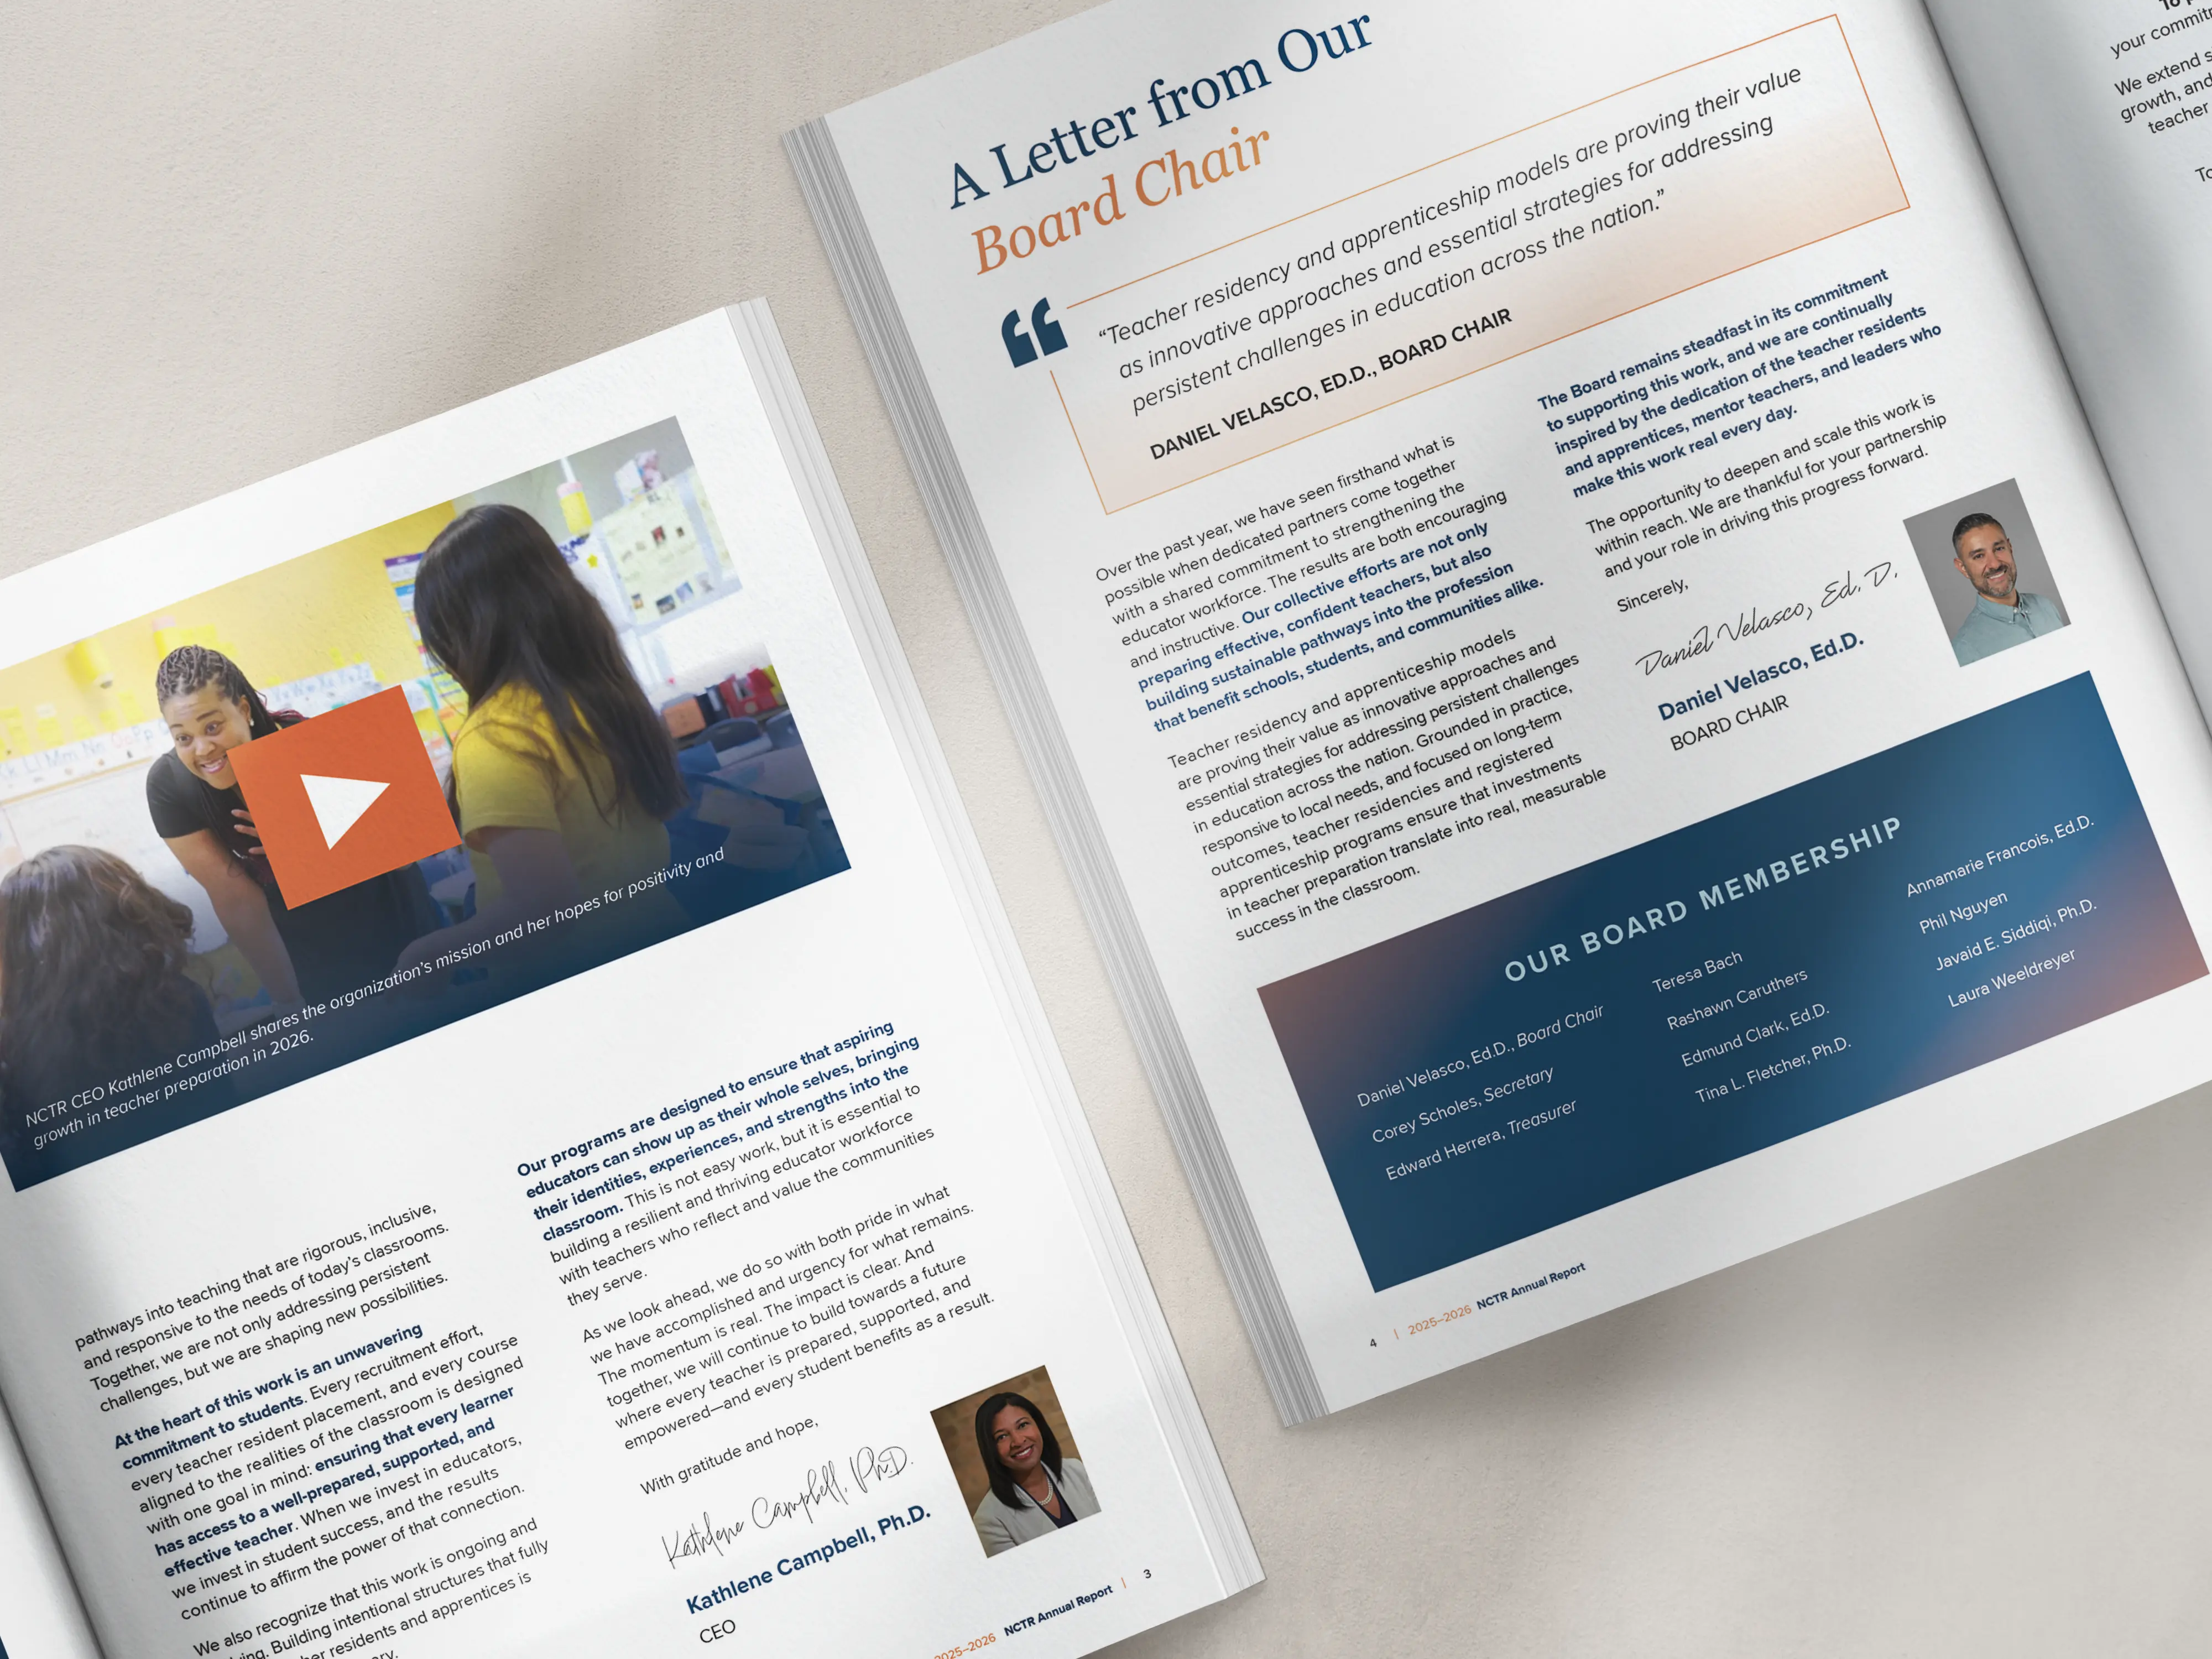
We built a 40-page digital report where the stories carry the data instead of sitting next to it.

So we:

  • Paired the headline numbers with quotes and graphic elements so each stat had a human anchor
  • Used charts for the stats that deserved a full beat, not for everything
  • Ran real program photography of events and participants through every section
  • Kept NCTR's existing brand intact and simply gave it a better stage

Then we did the smaller piece that gets used the most: a four-page impact brief. Same story, shorter outfit.

The part that mattered most was the conversation at the start. We didn't begin with what the report should look like. We began with what the report needed to do - explain the role, humanize the work, and make a first-time reader understand teacher residencies before they hit page five.
Get The Annual Report Checkpoint
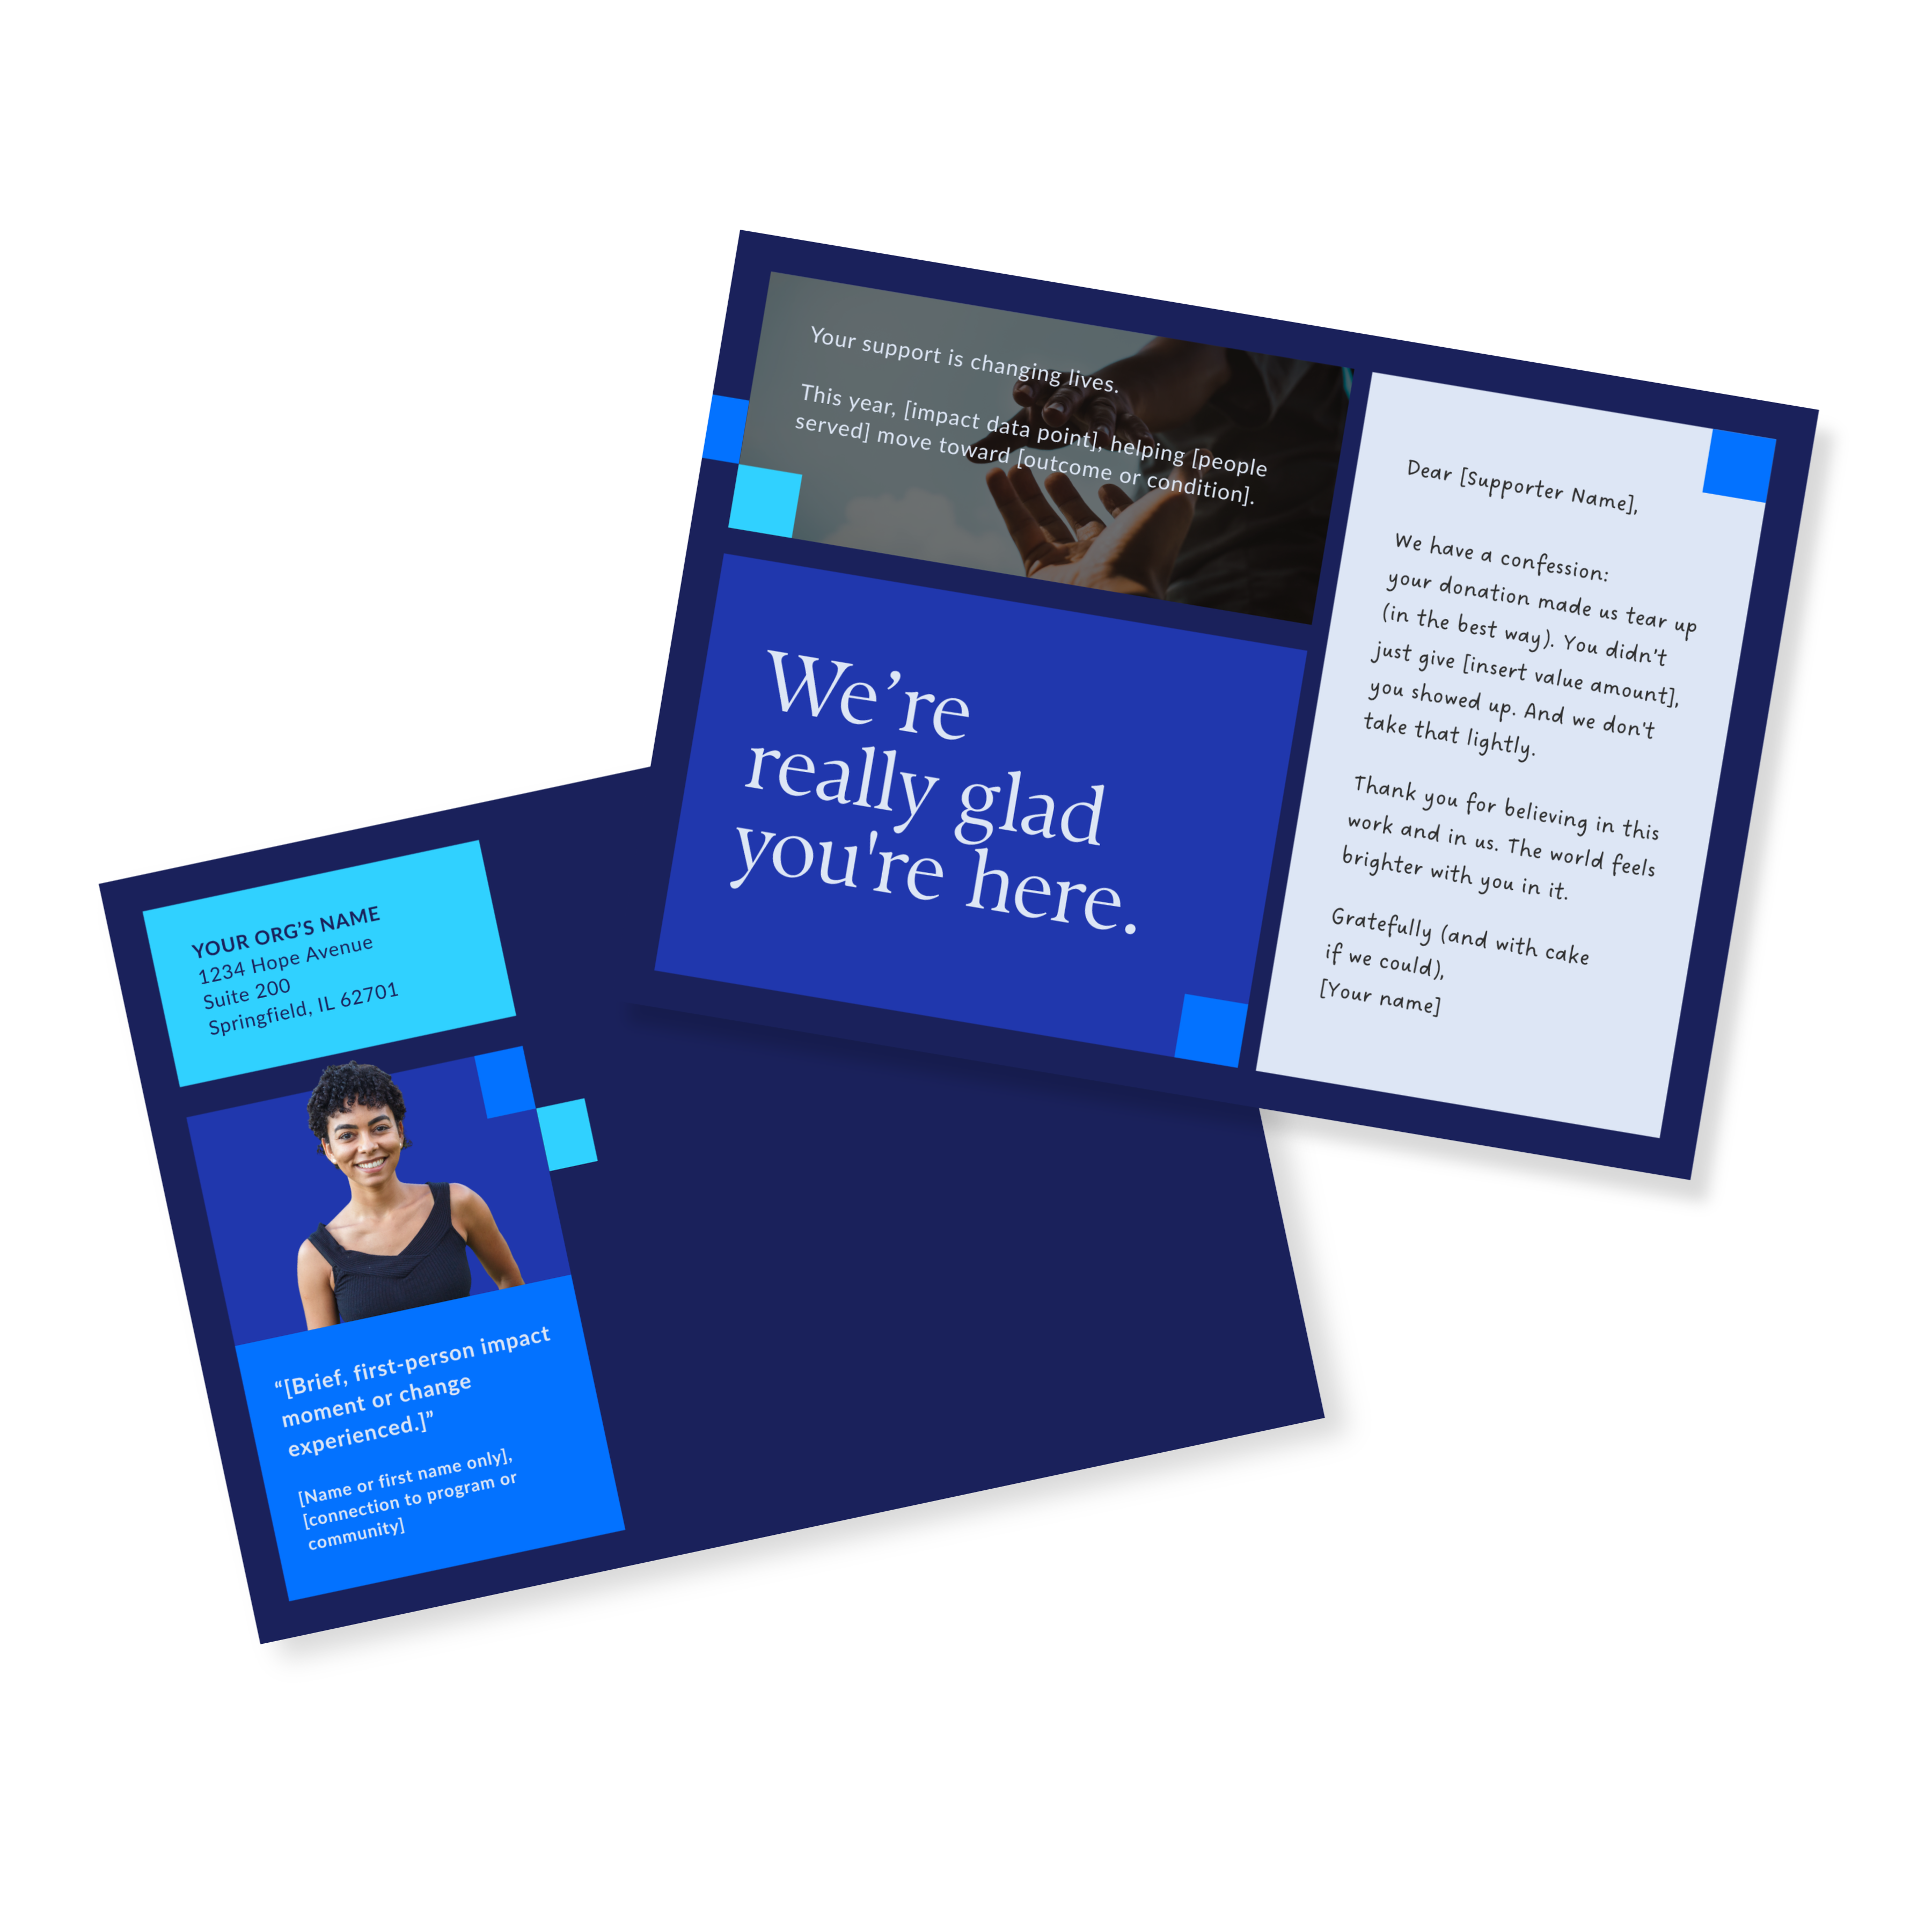
Donor Thank You Postcards Templates

Enter your info and we’ll send the postcards straight to your inbox:

What the Director of Marketing and Communications Said

"It was a wonderful experience working with Olivia! She not only listened to our needs, but also went the extra step to make sure she understood how we wanted our annual report designed. She also has a keen eye for bringing data points to life on the page, which made our report visually appealing. We appreciated the collaboration and look forward to working with her again."

- Alicia R., Director of Marketing and Communications, National Center For Teacher Residencies
__wf_reserved_inherit

One Report, Two Speeds

NCTR went from a report that listed numbers to one that explains a mission.

The 40-page version does the deep work. It gets reshared in donor meetings, repurposed for board presentations, and pulled up during giving campaigns.

The four-page brief does the wide work. Newsletters, social posts, event tables, the person who will never open a 40-page PDF.

That pairing is worth stealing. Most orgs build one artifact and then act surprised when it doesn't fit every room. A long report and a short brief are not two projects. They are one story at two speeds.

Before You Build This Year's Report, Score Last Year's

You can have great photos, solid numbers, a clean layout, a mission worth funding... and still leave readers unsure what you actually do.

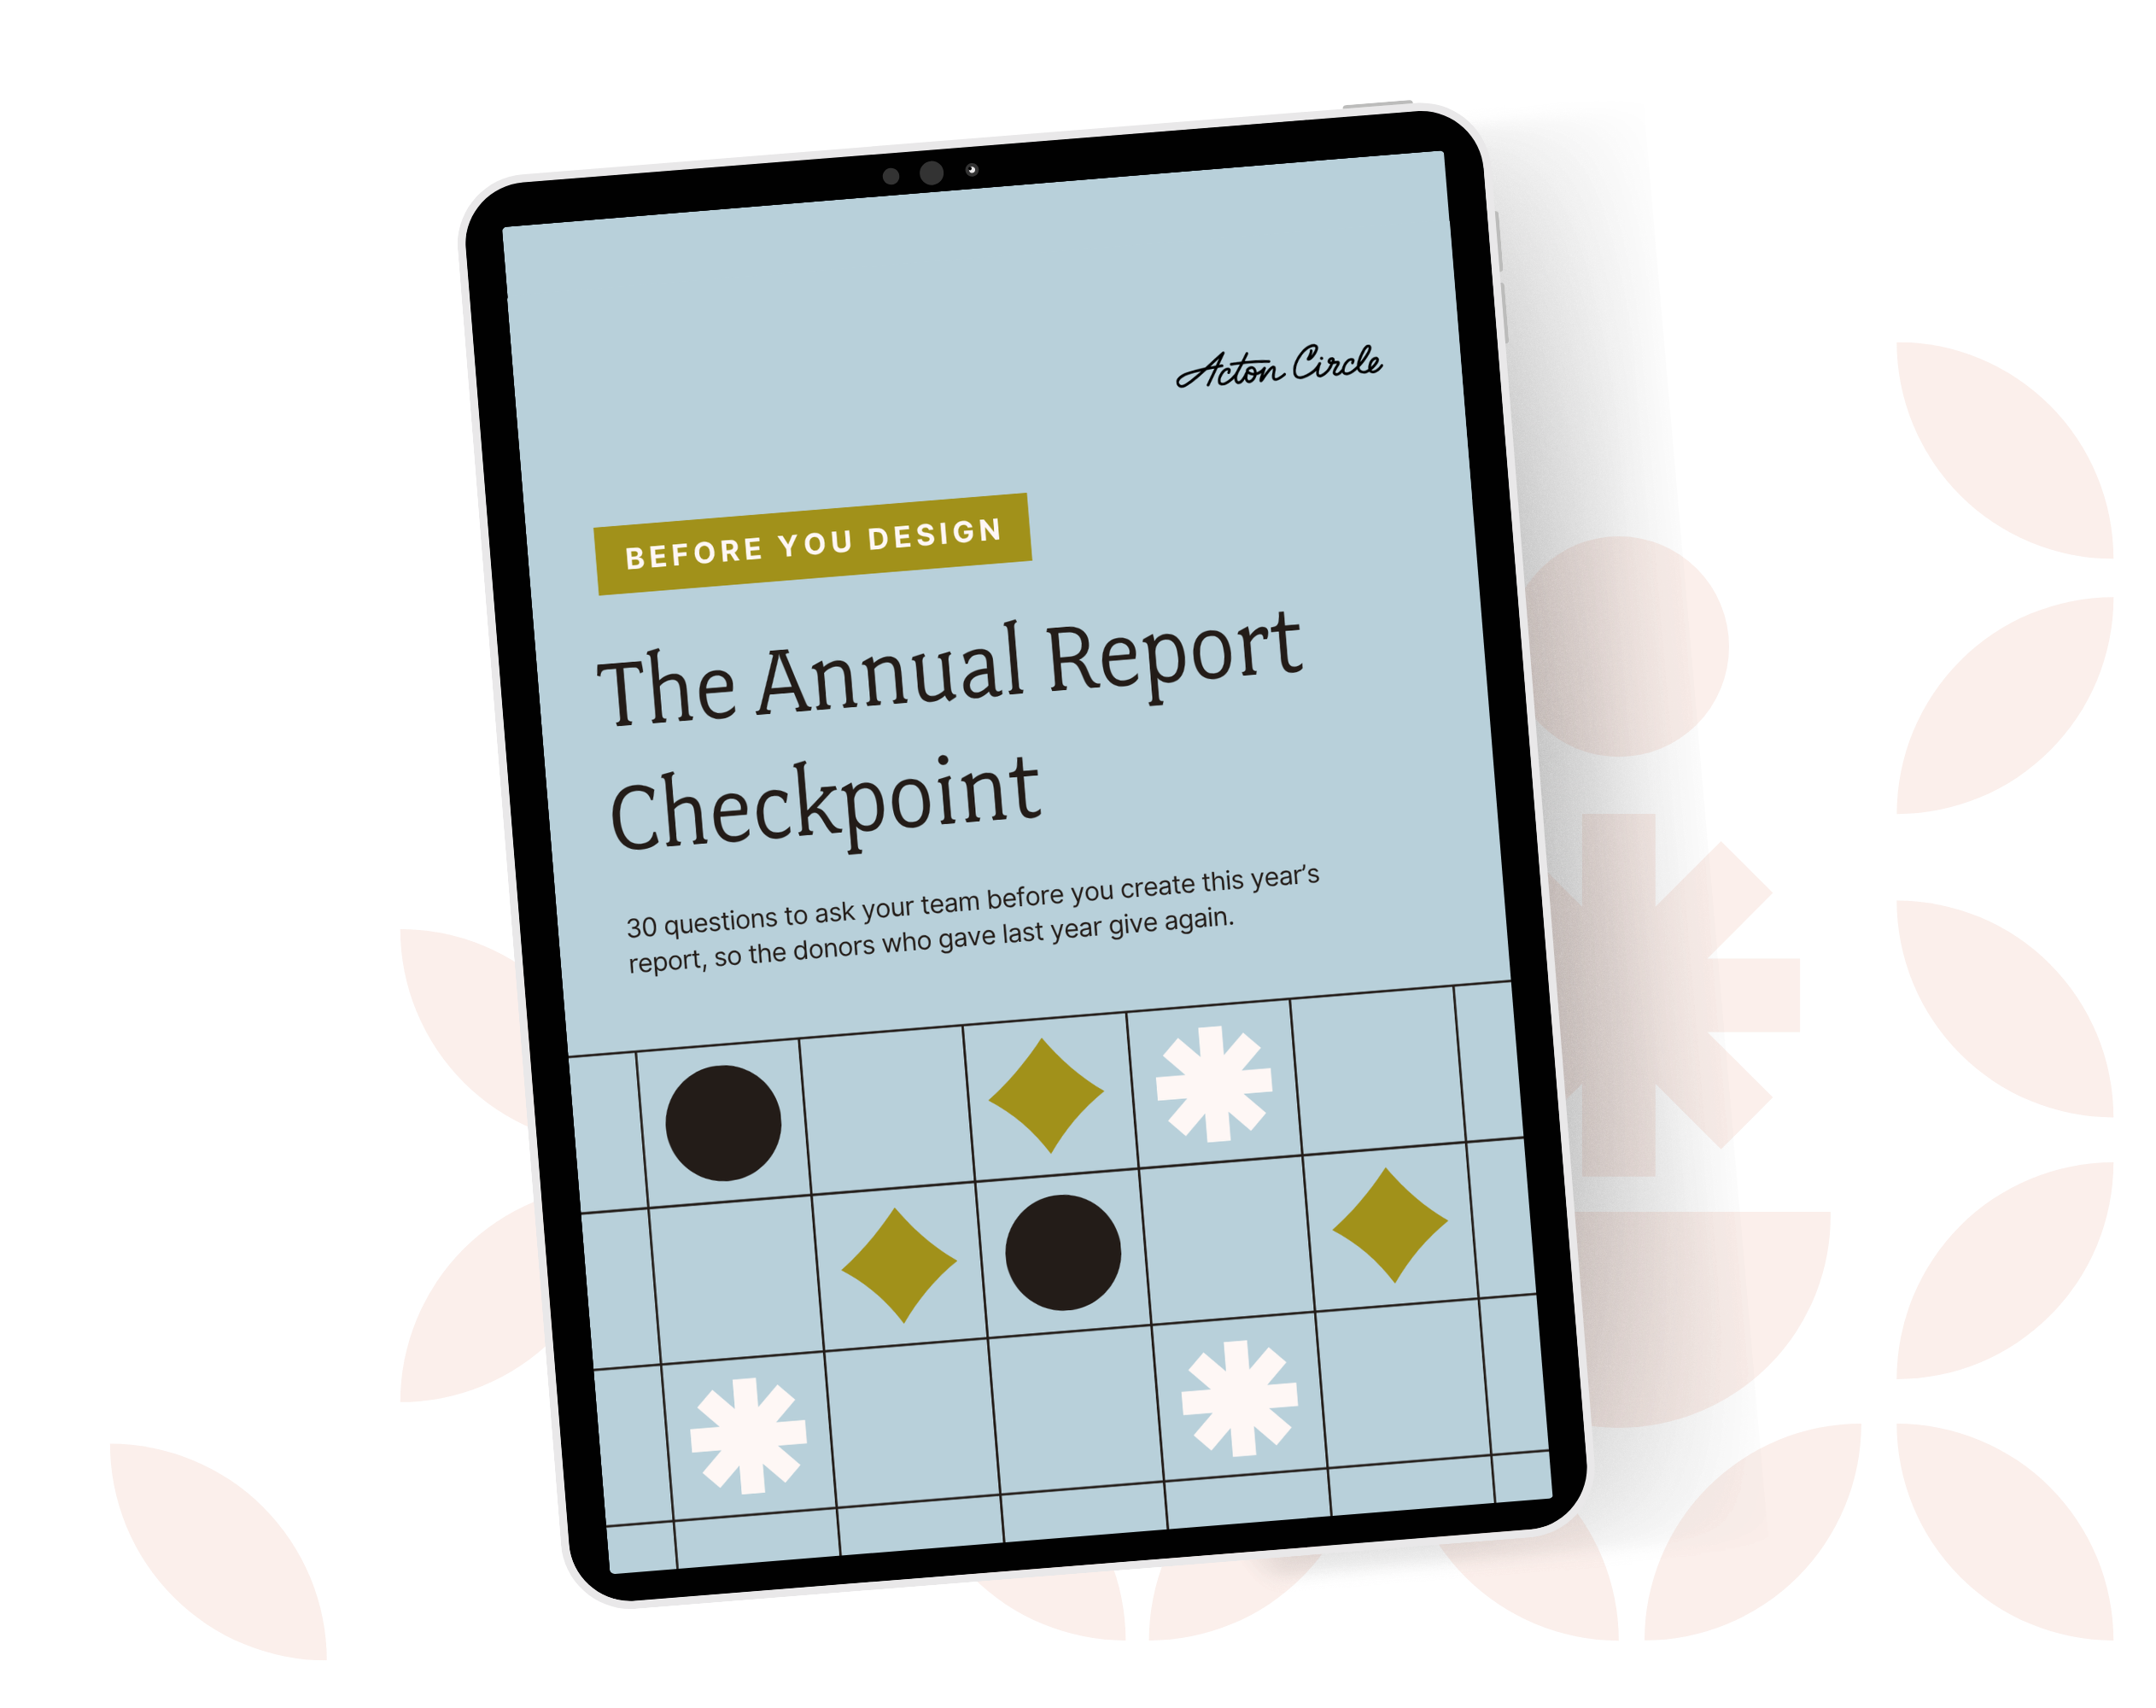
The Annual Report Checkpoint is a self-assessment that shows you where your report is building belief and where it's leaking trust.

It takes 10 minutes. And it'll save you a season of second-guessing.

See the full project in our portfolio: National Center for Teacher Residencies.

Related case studies: UMSI's first annual report and Planet Women's all-year annual report.
Ipad on a green floral background displaying an image of a blue, patterned PDF

Monthly Design Workshop

If you’re the one who usually handles design at your org, this is meant for you. You’ll leave with useful design tips you can start using right away.

see upcoming sessions
👋🏽 Hi, I'm Krista Reyes

I'm a writer and editor with almost a decade of professional experience. I spent most of my formative years working with local and international nonprofits, channeling my passion for worthy causes into written works with depth, value, and intention.

If I'm not working, you'll find me reading books, watching movies, playing chess, or bonding with my four dogs.

👋🏽 Hi, I'm Olivia Wheeler

I'm a creative leader with high standards for nonprofit storytelling. I work between homeschooling and gym sessions, obsess over typography, and believe your annual report should make supporters feel your mission in their bones.

I help nonprofits connect with new audiences and look like the org they're becoming, not the ones they were five years ago.

The stuff you’re wondering, answered straight

Why only 1 in 4 donor ever gives again

Your annual report is a stewardship and retention tool waiting to be used.

Most orgs treat it like a formality. Design it, ship it, forget it. Then wonder why the same donors don't show up again next year.

Donors leave because nobody showed them their gift mattered after they gave it.

First-time donors are THE MOST fragile group you have. One good report = a second gift.

We wrote about exactly how to use your annual report as a stewardship tool, not just a recap: Your Annual Report Is a Stewardship Tool. Here's How to Actually Use It That Way.

Why only 1 in 4 donor ever gives again

Great work along does not raise money

Programs don't fund themselves. Understood value does.

You can run the best program in your sector and still lose funding, because funders and donors don't fund what you did. They fund what they understood.

Most impact sections list activities. Meals served, kids reached, hours logged. None of that tells anyone what changed.

The gap isn't your work. It's the translation between your work and what the reader actually feels reading about it.

I broke this down here: How to Measure Your Nonprofit's Impact (And Make Sure It's Felt)

Great work along does not raise money

Where donors stop reading

Donors give you a few seconds before they decide if your report is worth their time.

Dense pages, no hierarchy, and nothing to pull the eye to what matters don't help.

I wrote about what actually earns attention in that window here: Annual Report Layout: Tips for a Report Donors Will Read

Where donors stop reading

A faster way to build your report

So you're doing your annual report solo again this year, huh? Same deal as last time: last year's PDF open in one tab so you can copy the bones, and a blank Canva doc that doesn't carry a single thing over.

A template is the thing that should've existed the first time you did this solo.

Here's a better approach to your report if you're handling it in-house: The Faster Way to a Beautiful Annual Report

A faster way to build your report

What you're not pulling from your own report

Your annual report is the most content-rich thing your org makes all year. And then it just sits on your website.

Real stories, real numbers, real proof your mission works, all sitting in one PDF that gets opened once and forgotten.

That same content could be twelve LinkedIn posts, three newsletter sends, a case study, a slide for your next pitch deck. Every one of those keeps your mission in front of donors between asks, not just during them.

More on how to make your report work past launch day: Simple and Flexible Annual Report Ideas for Busy Nonprofits

What you're not pulling from your own report

Explore more articles

Client Case Studies
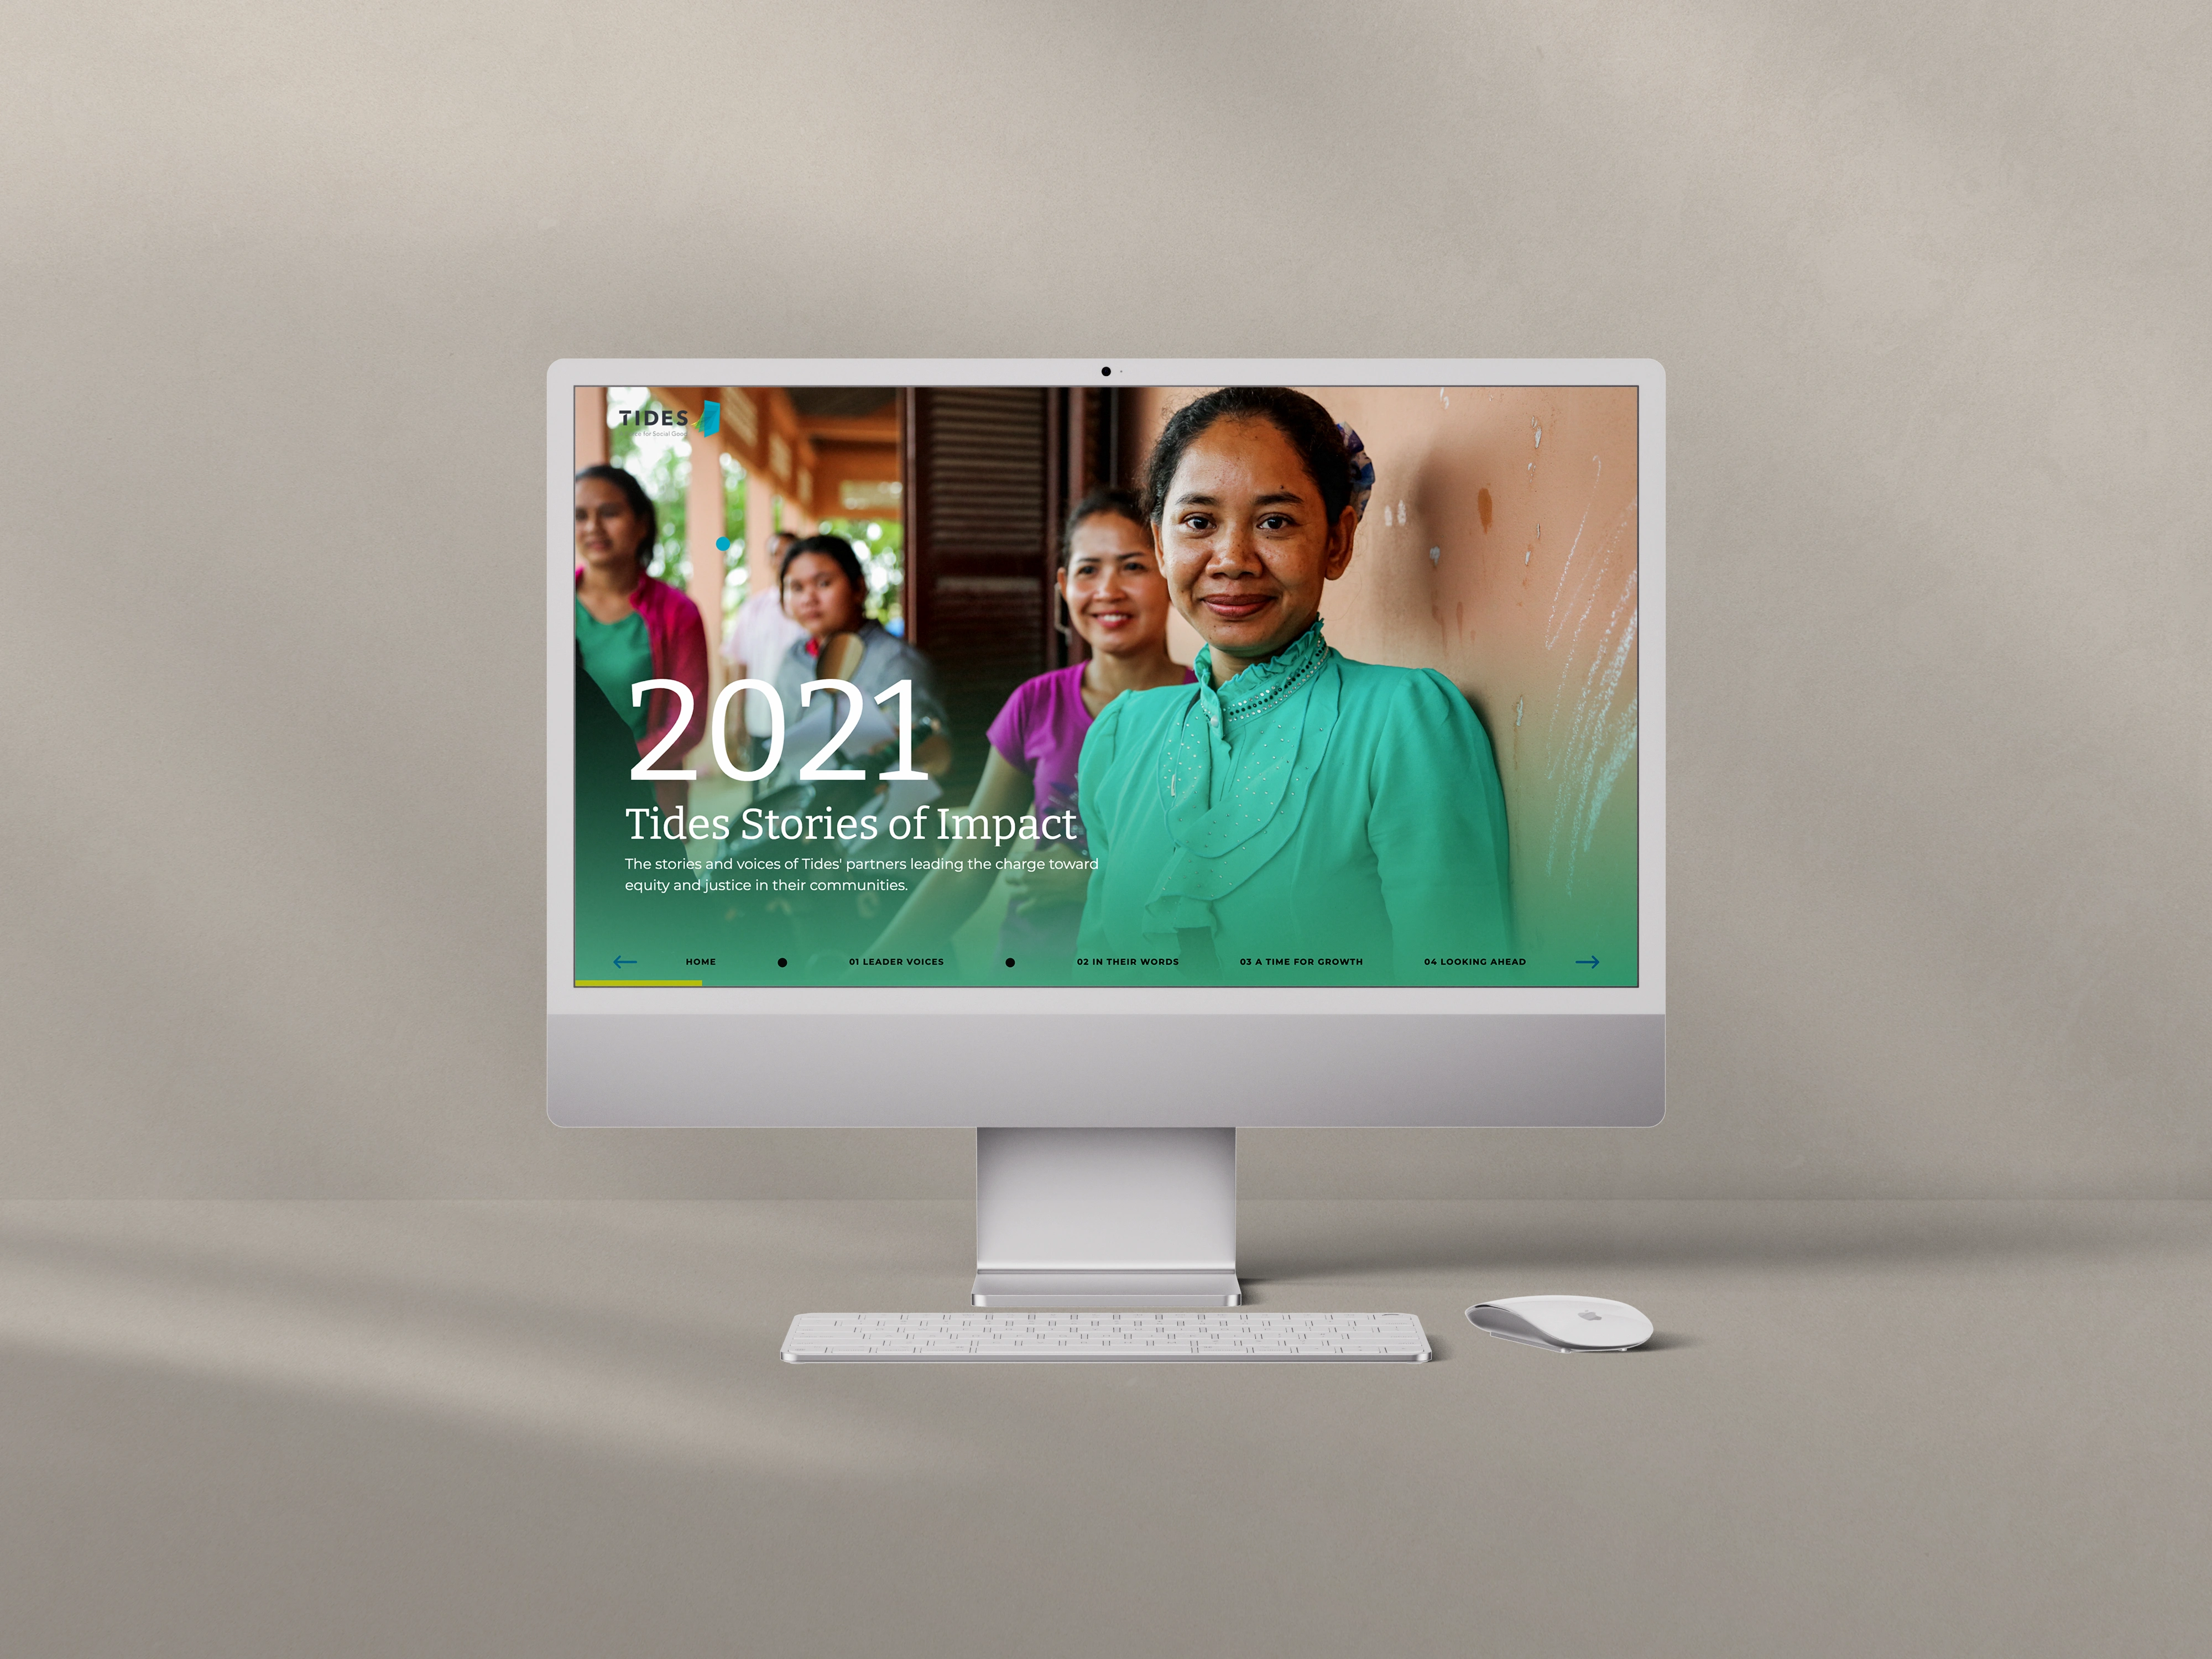
Tides wanted annual impact storytelling that lived online as an experience, not a PDF. Three microsites later, they have a digital language of their own.
Client Case Studies
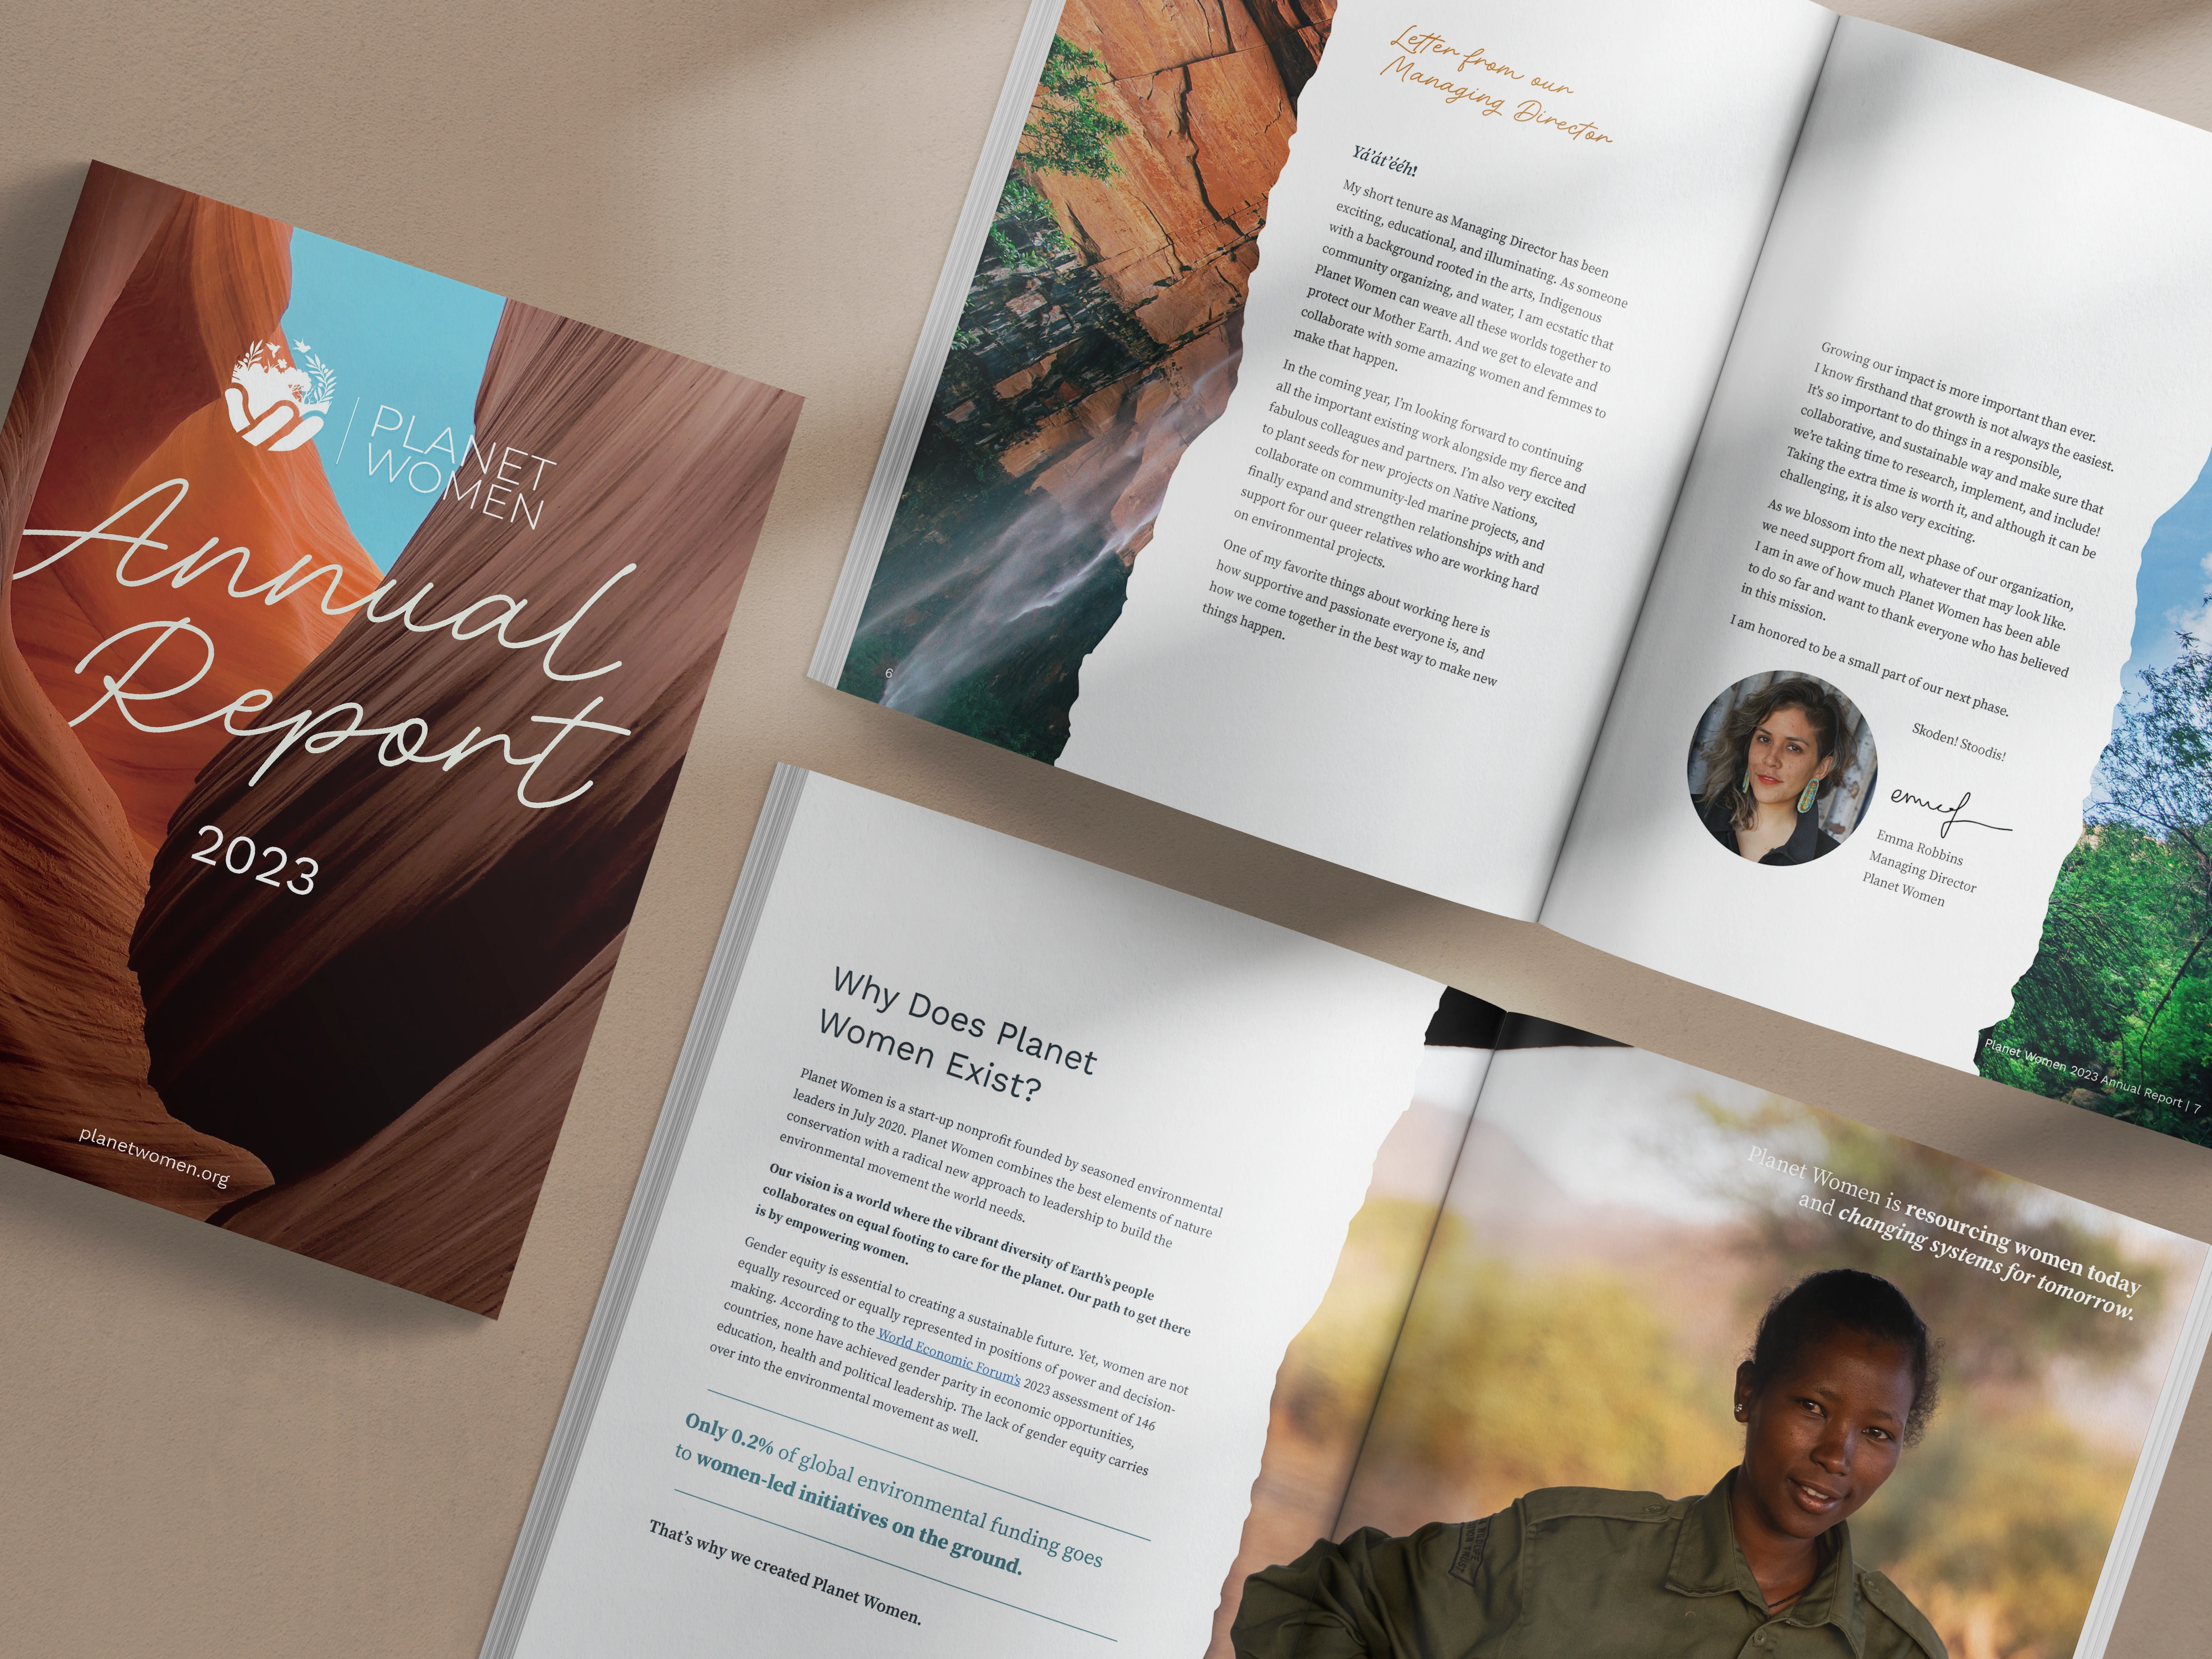
Planet Women needed a year-three report that matched their values and kept earning after launch week. Here is how it became a year-round asset.
Client Case Studies
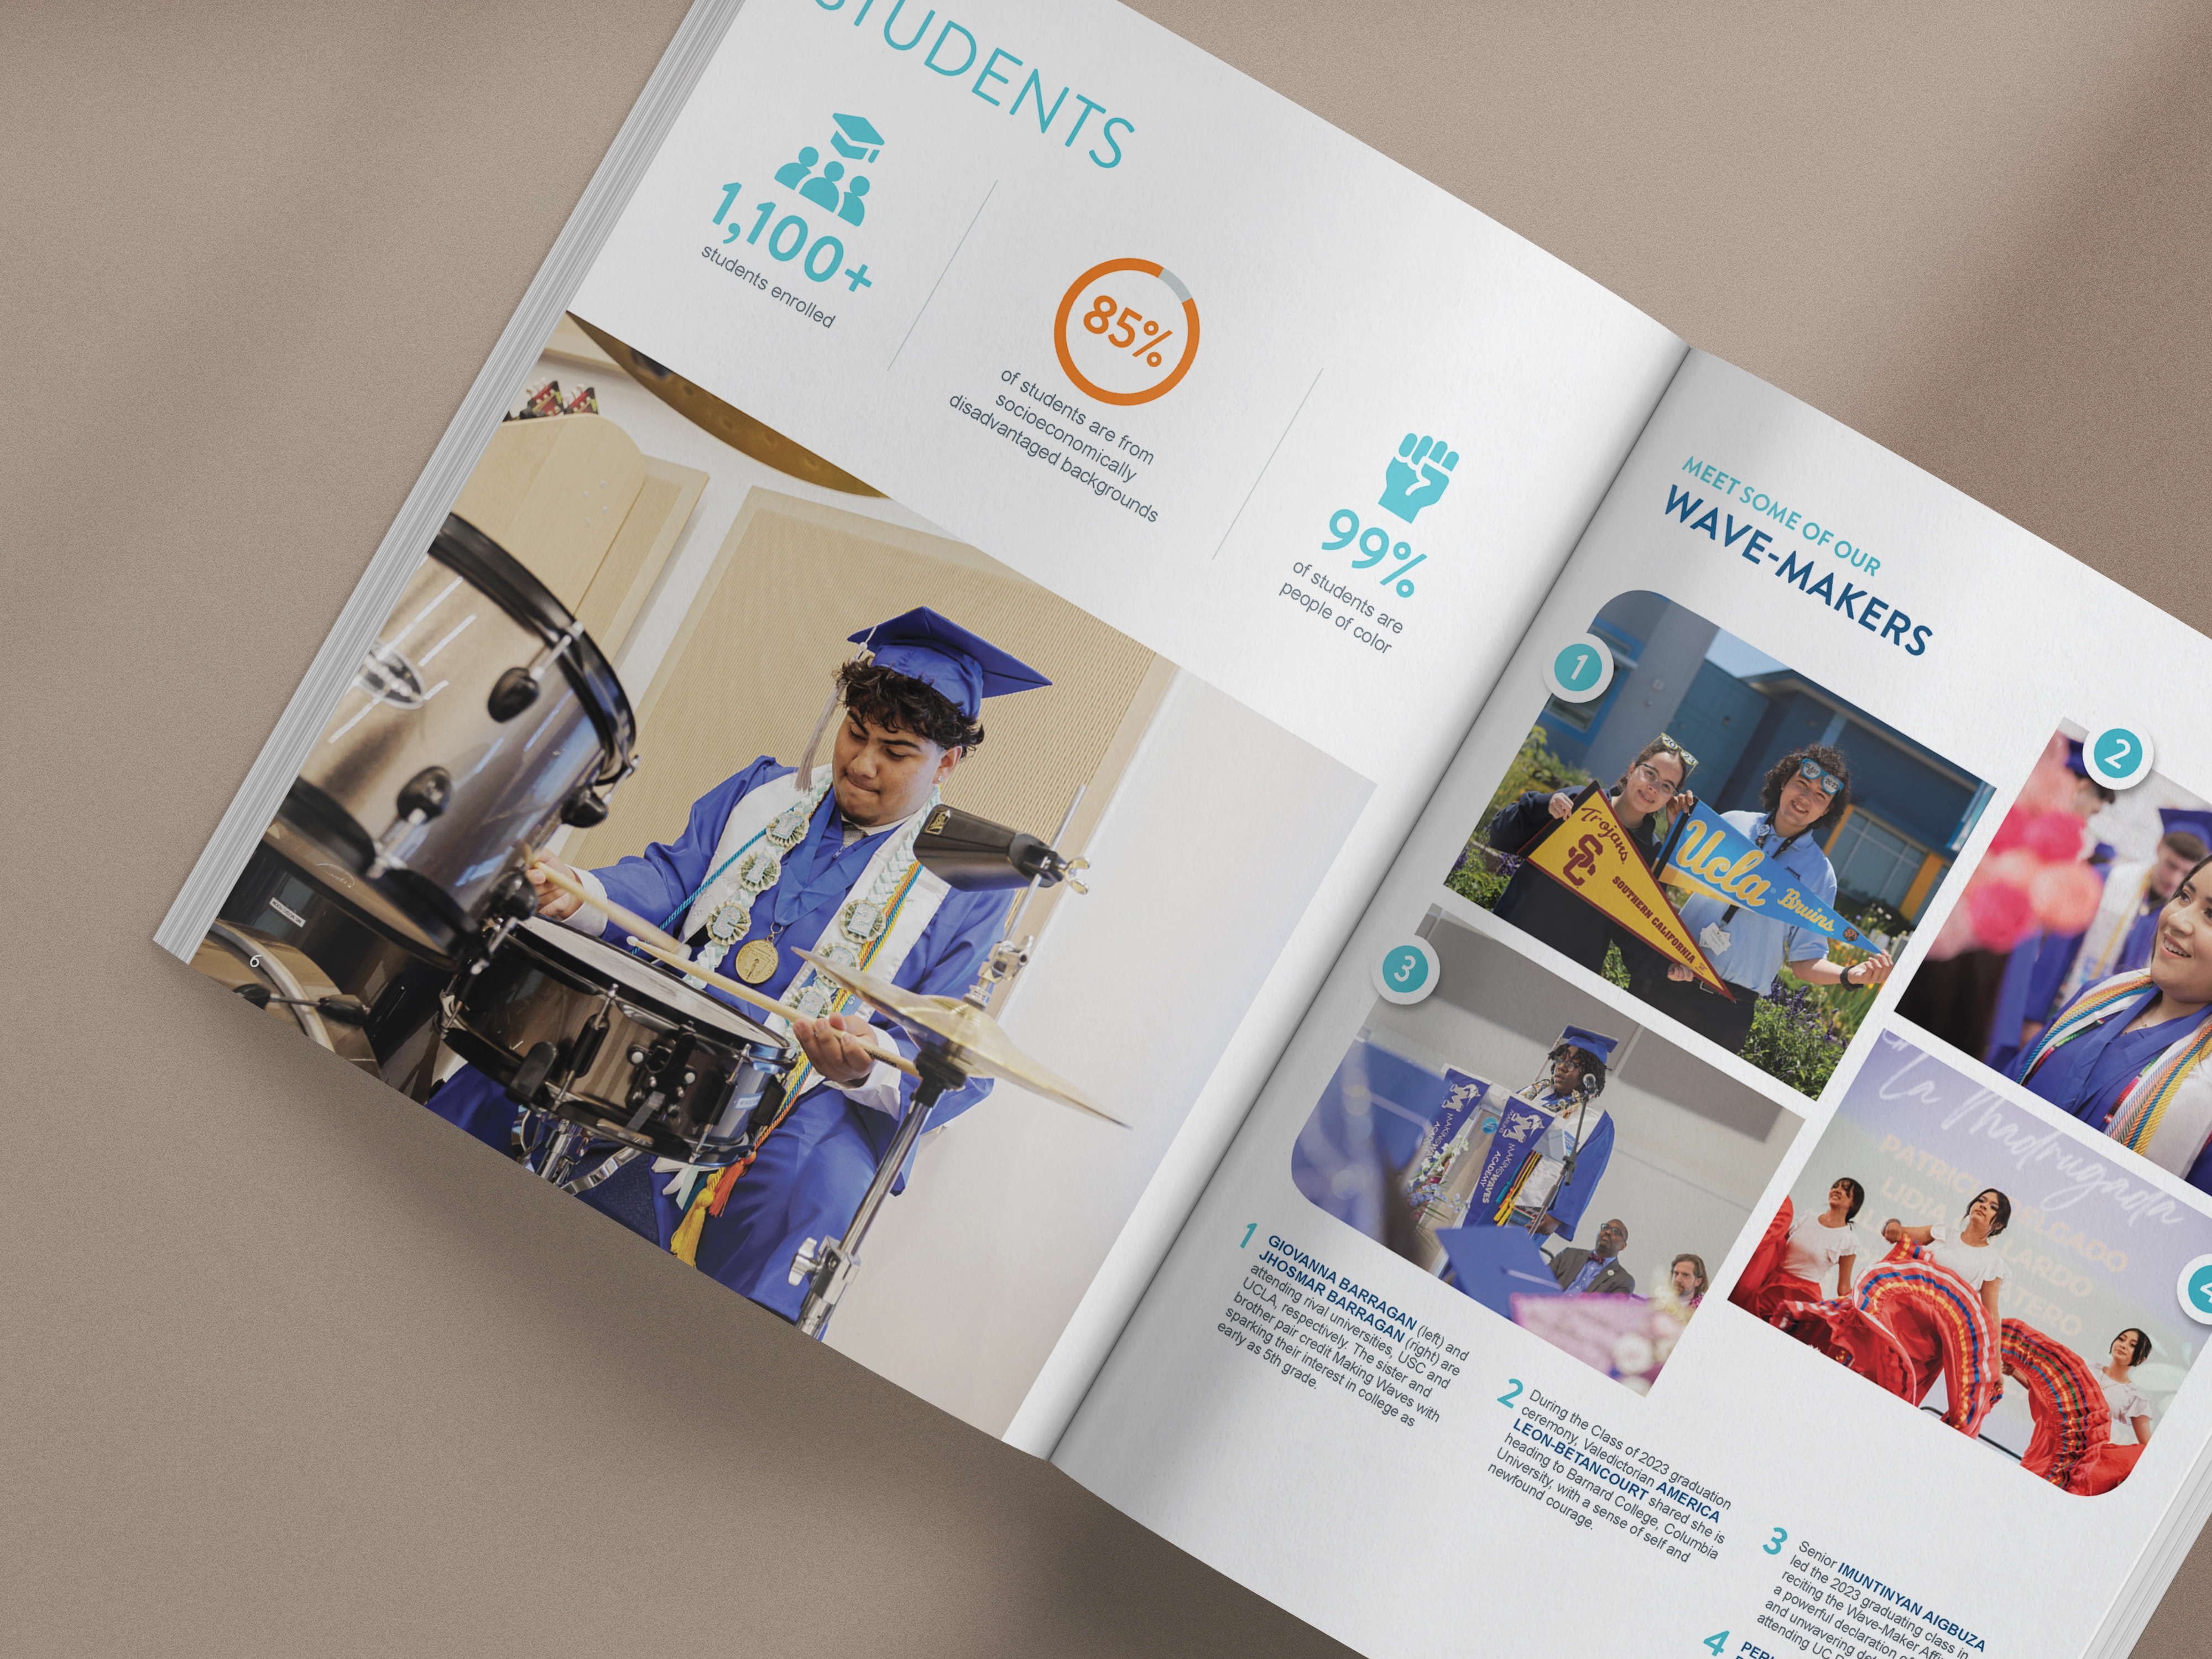
Making Waves needed separate reports for its Foundation and Academy that still felt like one mission. Four reports later, here is what worked.